Home » Student Resources » Online Chemistry Textbooks » CH450 and CH451: Biochemistry - Defining Life at the Molecular Level » Chapter 6: Enzyme Principles and Biotechnological Applications
MenuCH450 and CH451: Biochemistry - Defining Life at the Molecular Level
Chapter 6: Enzyme Principles and Biotechnological Applications
6.1 The Nature and Classification of Enzymes
6.2 Enzyme Names and Classification
6.3 Enzyme Structure and Substrate Binding
6.4 Enzymes and Reaction Equilibrium
6.5 Properties and Mechanisms of Enzyme Action
6.6 Enzymes are Affected by pH and Temperature
6.7 Enzymes are Sensitive to Inhibitors
6.8 Allosteric Regulators and the Control of Enzyme Activity
6.9 Origin, Purification, and Uses of Enzymes
6.10 Industrial Enzymology
6.11 References
6.1 The Nature and Classification of Enzymes
Remixed from Peter K. Robinson
Enzymes are biological catalysts (also known as biocatalysts) that speed up biochemical reactions in living organisms. They can also be extracted from cells and then used to catalyse a wide range of commercially important processes. For example, they have important roles in the production of sweetening agents and the modification of antibiotics, they are used in washing powders and various cleaning products, and they play a key role in analytical devices and assays that have clinical, forensic and environmental applications. The word ‘enzyme’ was first used by the German physiologist Wilhelm Kühne in 1878, when he was describing the ability of yeast to produce alcohol from sugars, and it is derived from the Greek words en (meaning ‘within’) and zume (meaning ‘yeast’).
In the late nineteenth century and early twentieth century, significant advances were made in the extraction, characterization and commercial exploitation of many enzymes, but it was not until the 1920s that enzymes were crystallized, revealing that catalytic activity is associated with protein molecules. For the next 60 years or so it was believed that all enzymes were proteins, but in the 1980s it was found that some ribonucleic acid (RNA) molecules are also able to exert catalytic effects. These RNAs, which are called ribozymes, play an important role in gene expression. In the same decade, biochemists also developed the technology to generate antibodies that possess catalytic properties. These so-called ‘abzymes’ have significant potential both as novel industrial catalysts and in therapeutics. Notwithstanding these notable exceptions, much of classical enzymology, and the remainder of this essay, is focused on the proteins that possess catalytic activity.
As catalysts, enzymes are only required in very low concentrations, and they speed up reactions without themselves being consumed during the reaction. We usually describe enzymes as being capable of catalyzing the conversion of substrate molecules into product molecules as follows:
-
Enzymes are potent catalysts.
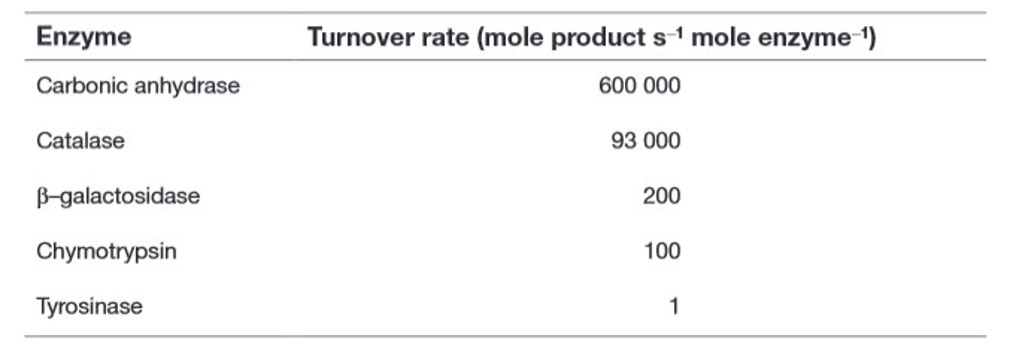
The enormous catalytic activity of enzymes can perhaps best be expressed by a constant, kcat, that is variously referred to as the turnover rate, turnover frequency or turnover number. This constant represents the number of substrate molecules that can be converted to product by a single enzyme molecule per unit time (usually per minute or per second). Examples of turnover rate values are listed in Table 6.1. For example, a single molecule of carbonic anhydrase can catalyse the conversion of over half a million molecules of its substrates, carbon dioxide (CO2) and water (H2O), into the product, bicarbonate (HCO3−), every second—a truly remarkable achievement.
-
Enzymes are specific catalysts
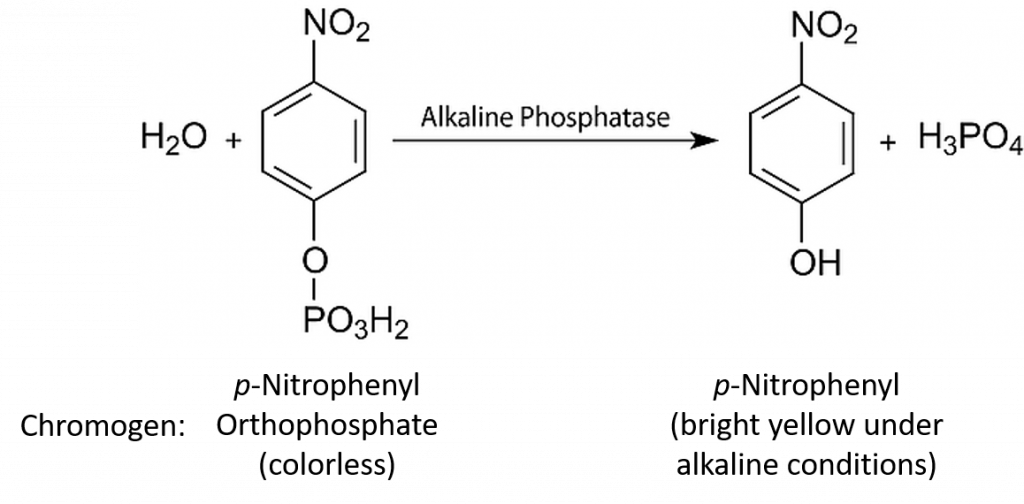
As well as being highly potent catalysts, enzymes also possess remarkable specificity in that they generally catalyze the conversion of only one type (or at most a range of similar types) of substrate molecule into product molecules. Some enzymes demonstrate group specificity. For example, alkaline phosphatase (an enzyme that is commonly encountered in first-year laboratory sessions on enzyme kinetics) can remove a phosphate group from a variety of substrates.
Other enzymes demonstrate much higher specificity, which is described as absolute specificity. For example, glucose oxidase shows almost total specificity for its substrate, β-D-glucose, and virtually no activity with any other monosaccharides. As we shall see later, this specificity is of paramount importance in many analytical assays and devices (biosensors) that measure a specific substrate (e.g. glucose) in a complex mixture (e.g. a blood or urine sample).
Table 6.1 Turnover Rate of Some Common Enzymes Showing Wide Variation
back to the top
6.2 Enzyme Names and Classification
Enzymes typically have common names (often called ‘trivial names’) which refer to the reaction that they catalyze, with the suffix ‘-ase’ (e.g. oxidase, dehydrogenase, carboxylase), although individual proteolytic enzymes generally have the suffix ‘-in’ (e.g. trypsin, chymotrypsin, papain). Often the trivial name also indicates the substrate on which the enzyme acts (e.g. glucose oxidase, alcohol dehydrogenase, pyruvate decarboxylase). However, some trivial names (e.g. invertase, diastase, catalase) provide little information about the substrate, the product or the reaction involved.
Due to the growing complexity of and inconsistency in the naming of enzymes, the International Union of Biochemistry set up the Enzyme Commission to address this issue. The first Enzyme Commission Report was published in 1961, and provided a systematic approach to the naming of enzymes. The sixth edition, published in 1992, contained details of nearly 3,200 different enzymes, and supplements published annually have now extended this number to over 5,000.
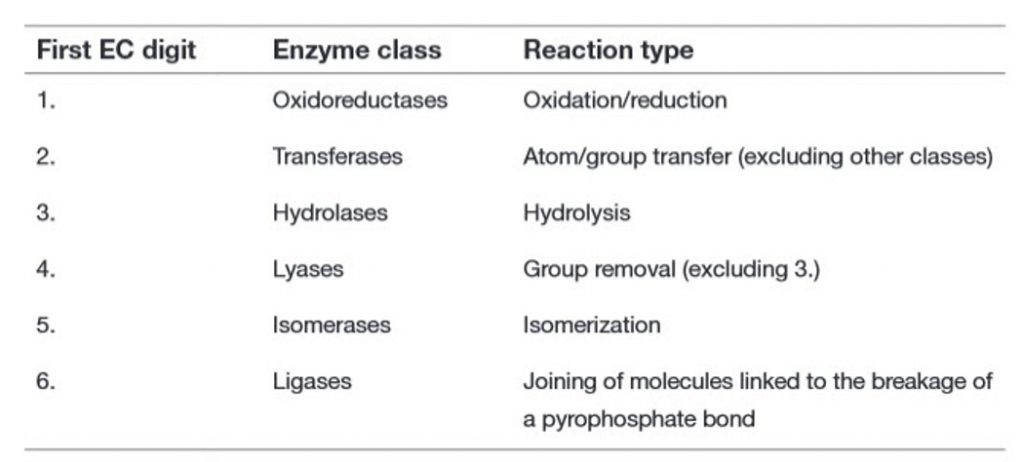
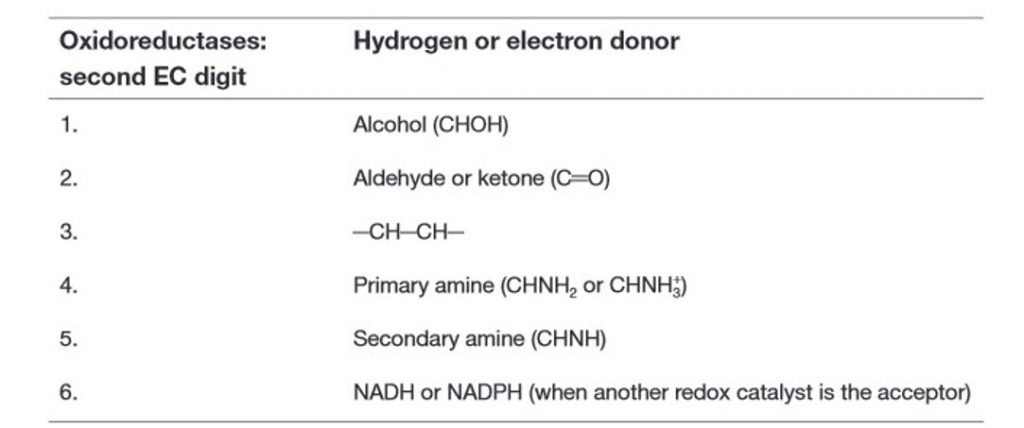
Within this system, all enzymes are described by a four-part Enzyme Commission (EC) number. For example, the enzyme with the trivial name lactate dehydrogenase has the EC number 1.1.1.27, and is more correctly called l–lactate: NAD+ oxidoreductase. The first part of the EC number refers to the reaction that the enzyme catalyzes (Table 6.2). The remaining digits have different meanings according to the nature of the reaction identified by the first digit. For example, within the oxidoreductase category, the second digit denotes the hydrogen donor (Table 6.3) and the third digit denotes the hydrogen acceptor (Table 6.4). Thus lactate dehydrogenase with the EC number 1.1.1.27 is an oxidoreductase (indicated by the first digit) with the alcohol group of the lactate molecule as the hydrogen donor (second digit) and NAD+ as the hydrogen acceptor (third digit), and is the 27th enzyme to be categorized within this group (fourth digit).
Table 6.2 Enzyme Classification: Main Classes of Enzymes in the EC System
Table 6.3 Enzyme Classification: Secondary Classes of Oxidoreductases in the EC System
Table 6.4 Enzyme Classifications: Tertiary Classes of Oxidoreductases in the EC System
Fortunately, it is now very easy to find this information for any individual enzyme using the Enzyme Nomenclature Database (available at http://enzyme.expasy.org)
back to the top
6.3 Enzyme Structure and Substrate Binding
Amino acid-based enzymes are globular proteins that range in size from less than 100 to more than 2,000 amino acid residues. These amino acids can be arranged as one or more polypeptide chains that are folded and bent to form a specific three-dimensional structure, incorporating a small area known as the active site (Figure 6.1), where the substrate actually binds. The active site may well involve only a small number (less than 10) of the constituent amino acids. It is the shape and charge properties of the active site that enable it to bind to a single type of substrate molecule, so that the enzyme is able to demonstrate considerable specificity in its catalytic activity.
The hypothesis that enzyme specificity results from the complementary nature of the substrate and its active site was first proposed by the German chemist Emil Fischer in 1894, and became known as Fischer’s ‘lock and key hypothesis’, whereby only a key of the correct size and shape (the substrate) fits into the keyhole (the active site) of the lock (the enzyme). It is astounding that this theory was proposed at a time when it was not even established that enzymes were proteins.
Figure 6.1 Representation of Substrate Binding to the Active Site of an Enzyme Molecule.
As more was learned about enzyme structure through techniques such as X-ray crystallography, it became clear that enzymes are not rigid structures, but are in fact quite flexible in shape. In the light of this finding, in 1958 Daniel Koshland extended Fischer’s ideas and presented the ‘induced-fit model’ of substrate and enzyme binding, in which the enzyme molecule changes its shape slightly to accommodate the binding of the substrate. The analogy that is commonly used is the ‘hand-in-glove model’, where the hand and glove are broadly complementary in shape, but the glove is molded around the hand as it is inserted in order to provide a perfect match.
Since it is the active site alone that binds to the substrate, it is logical to ask what is the role of the rest of the protein molecule. The simple answer is that it acts to stabilize the active site and provide an appropriate environment for interaction of the site with the substrate molecule. Therefore the active site cannot be separated out from the rest of the protein without loss of catalytic activity, although laboratory-based directed (or forced) evolution studies have shown that it is sometimes possible to generate smaller enzymes that do retain activity. Other regions of the enzyme may also be involved in the regulation of enzyme activity, which will be discussed in further detail in Chapter 8.
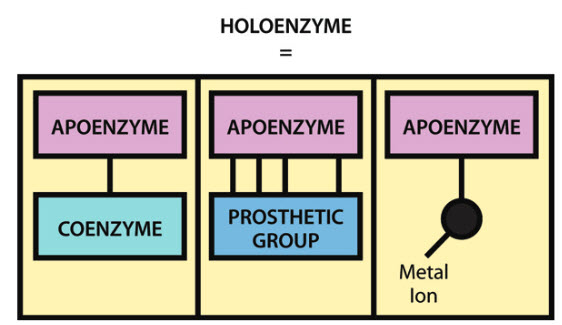
It should be noted that although a large number of enzymes consist solely of protein, many also contain a non-protein component, known as a cofactor, that is necessary for the enzyme’s catalytic activity. A cofactor may be another organic molecule, in which case it is called a coenzyme, or it may be an inorganic molecule, typically a metal ion such as iron, manganese, cobalt, copper or zinc. A coenzyme that binds tightly and permanently to the protein is generally referred to as the prosthetic group of the enzyme. When an enzyme requires a cofactor for its activity, the inactive protein component is generally referred to as an apoenzyme, and the apoenzyme plus the cofactor (i.e. the active enzyme) is called a holoenzyme (Figure 6.2). The need for minerals and vitamins in the human diet is partly attributable to their roles within metabolism as cofactors and coenzymes.
Figure 6.2 The Components of a Holoenzyme
back to the top
6.4 Enzymes and Reaction Equilibrium
-
Enzymes Enhance Reaction Rates
How do enzymes work? The broad answer to this question is that they DO NOT alter the equilibrium (i.e. the thermodynamics) of a reaction. This is because enzymes do not fundamentally change the structure and energetics of the products and reagents, but rather they simply allow the reaction equilibrium to be attained more rapidly. Let us therefore begin by clarifying the concept of chemical equilibrium. In many cases the equilibrium of a reaction is far ‘to the right’—that is, virtually all of the substrate (S) is converted into product (P). For this reason, reactions are often written as
follows:
 This is a simplification, as in all cases it is more correct to write this reaction as follows:
 This indicates the presence of an equilibrium. To understand this concept it is perhaps most helpful to look at a reaction where the equilibrium point is quite central. For example:
 In this reaction, if we start with a solution of 1 M glucose and add the enzyme, then upon completion we will have a mixture of approximately 0.5 M glucose and 0.5 M fructose. This is the equilibrium point of this particular reaction. Although it may only take a couple of seconds to reach this end point with the enzyme present, we would in fact, come to the same point if we put glucose into solution and waited many months for the reaction to occur in the absence of the enzyme. Interestingly, we could also have started this reaction with a 1M fructose solution, and it would have proceeded in the opposite direction until the same equilibrium point had been reached.
The equilibrium point for this reaction is expressed by the equilibrium constant, Keq, as follows:
Thus for a reaction with central equilibrium, Keq = 1, for an equilibrium ‘to the right,’ Keq is >1, and for an equilibrium ‘to the left,’ Keq is < 1. Therefore if a reaction has a Keq value of 106, the equilibrium is very far to the right and can be simplified by denoting it as a single arrow. We may often describe this type of reaction as ‘going to completion’. Conversely, if a reaction has a Keq value of 10−6, the equilibrium is very far to the left, and for all practical purposes it would not really be considered to proceed at all.
It should be noted that although the concentration of reactants has no effect on the equilibrium point, environmental factors such as pH and temperature can and do affect the position of the equilibrium. It should also be noted that any biochemical reaction which occurs, in vivo, in a living system does not occur in isolation, but as part of a metabolic pathway, which makes it more difficult to conceptualize the relationship between reactants and reactions. In vivo, reactions are not allowed to proceed to their equilibrium position. If they did, the reaction would essentially stop (i.e. the forward and reverse reactions would balance each other), and there would be no net flux through the pathway. However, in many complex biochemical pathways some of the individual reaction steps are close to equilibrium, whereas others are far from equilibrium, the latter (catalyzed by regulatory enzymes) having the greatest capacity to control the overall flux of materials through the pathway.
-
Enzymes Form Complexes with their Substrates
We often describe an enzyme-catalysed reaction as proceeding through three stages as follows:
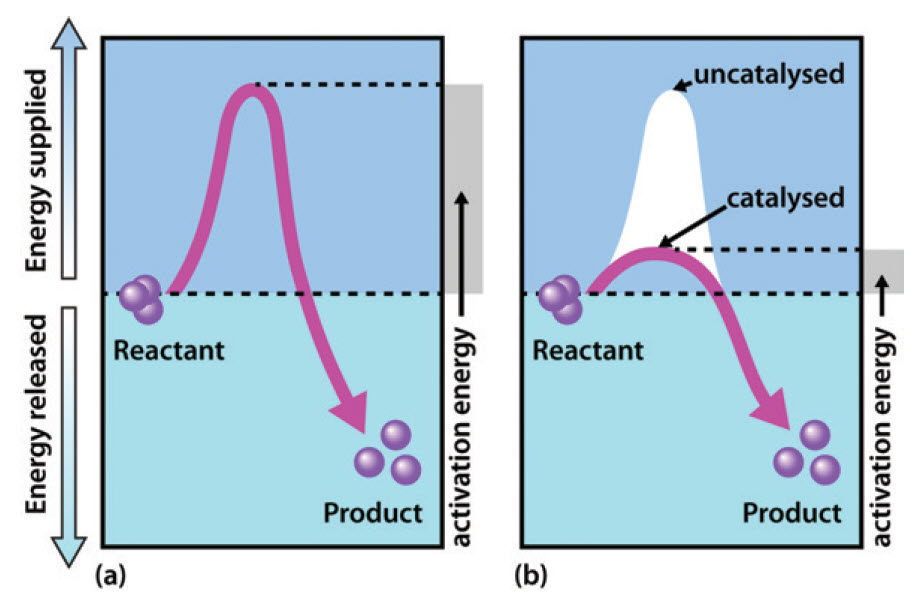
 The ES complex represents a position where the substrate (S) is bound to the enzyme (E) such that the reaction (whatever it might be) is made more favorable. As soon as the reaction has occurred, the product molecule (P) dissociates from the enzyme, which is then free to bind to another substrate molecule. At some point during this process the substrate is converted into an intermediate form (often called the transition state) and then into the product. The exact mechanism whereby the enzyme acts to increase the rate of the reaction differs from one system to another, and is the topic of Chapter 7. However, the general principle is that by binding of the substrate to the enzyme, the reaction involving the substrate is made more favourable by lowering the activation energy of the reaction.
In terms of energetics, reactions can be either exergonic (releasing energy) or endergonic (consuming energy). However, even in an exergonic reaction a small amount of energy, termed the activation energy, is needed to give the reaction a ‘kick start.’ A good analogy is that of a match, the head of which contains a mixture of energy-rich chemicals (phosphorus sesquisulfide and potassium chlorate). When a match burns it releases substantial amounts of light and heat energy (exergonically reacting with O2 in the air). However, and perhaps fortunately, a match will not spontaneously ignite, but rather a small input of energy in the form of heat generated through friction (i.e. striking of the match) is needed to initiate the reaction. Of course once the match has been struck the amount of energy released is considerable, and greatly exceeds the small energy input during the striking process.
As shown in Figure 6.3, enzymes are considered to lower the activation energy of a system by making it energetically easier for the transition state to form. In the presence of an enzyme catalyst, the formation of the transition state is energetically more favourable (i.e. it requires less energy for the ‘kick start’), thereby accelerating the rate at which the reaction will proceed, but not fundamentally changing the energy levels of either the reactant or the product.
Figure 6.3 Effect of an enzyme on reducint the activation energy required to start a reaction where (a) is uncatalyzed and (b) is an enzyme-catalyzed reaction.
back to the top
6.5 Properties and Mechanisms of Enzyme Action
-
Enzyme Kinetics
Enzyme kinetics is the study of factors that determine the speed of enzyme-catalysed reactions. It utilizes some mathematical equations that can be confusing to students when they first encounter them. However, the theory of kinetics is both logical and simple, and it is essential to develop an understanding of this subject in order to be able to appreciate the role of enzymes both in metabolism and in biotechnology.
Assays (measurements) of enzyme activity can be performed in either a discontinuous or continuous fashion. Discontinuous methods involve mixing the substrate and enzyme together and measuring the product formed after a set period of time, so these methods are generally easy and quick to perform. In general we would use such discontinuous assays when we know little about the system (and are making preliminary investigations), or alternatively when we know a great deal about the system and are certain that the time interval we are choosing is appropriate.
In continuous enzyme assays we would generally study the rate of an enzyme-catalysed reaction by mixing the enzyme with the substrate and continuously measuring the appearance of product over time. Of course we could equally well measure the rate of the reaction by measuring the disappearance of substrate over time. Apart from the actual direction (one increasing and one decreasing), the two values would be identical. In enzyme kinetics experiments, for convenience we very often use an artificial substrate called a chromogen that yields a brightly coloured product, making the reaction easy to follow using a colorimeter or a spectrophotometer. However, we could in fact use any available analytical equipment that has the capacity to measure the concentration of either the product or the substrate.
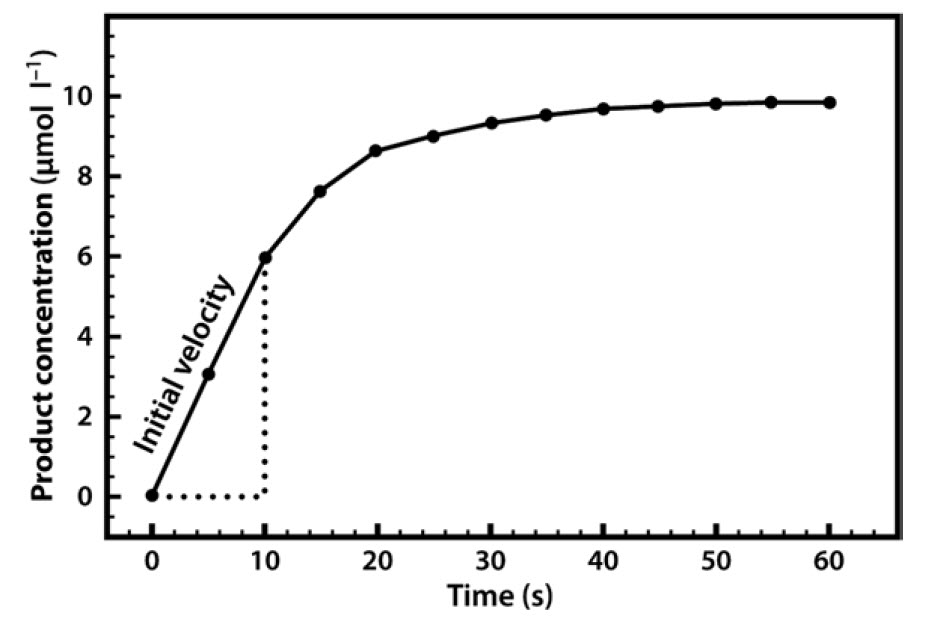
In almost all cases we would also add a buffer solution to the mixture. As we shall see, enzyme activity is strongly influenced by pH, so it is important to set the pH at a specific value and keep it constant throughout the experiment. Our first enzyme kinetics experiment may therefore involve mixing a substrate solution (chromogen) with a buffer solution and adding the enzyme. This mixture would then be placed in a spectrophotometer and the appearance of the coloured product would be measured. This would enable us to follow a rapid reaction which, after a few seconds or minutes, might start to slow down, as shown in Figure 6.4.
Figure 6.4 Formation of Product in an Enzyme-Catalyzed Reaction, Plotted Against Time.
A common reason for this slowing down of the speed (rate) of the reaction is that the substrate within the mixture is being used up and thus becoming limiting. Alternatively, it may be that the enzyme is unstable and is denaturing over the course of the experiment, or it could be that the pH of the mixture is changing, as many reactions either consume or release protons. For these reasons, when we are asked to specify the rate of a reaction we do so early on, as soon as the enzyme has been added, and when none of the above-mentioned limitations apply. We refer to this initial rapid rate as the initial velocity (v0). Measurement of the reaction rate at this early stage is also quite straightforward, as the rate is effectively linear, so we can simply draw a straight line and measure the gradient (by dividing the concentration change by the time interval) in order to evaluate the reaction rate over this period.
We may now perform a range of similar enzyme assays to evaluate how the initial velocity changes when the substrate or enzyme concentration is altered, or when the pH is changed. These studies will help us to characterize the properties of the enzyme under study.
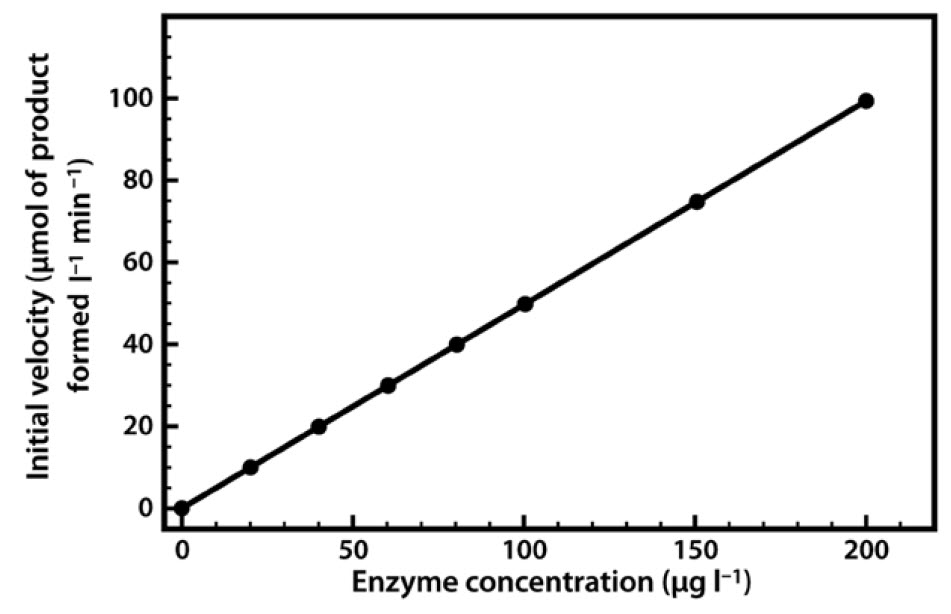
The relationship between enzyme concentration and the rate of the reaction is usually a simple one. If we repeat the experiment just described, but add 10% more enzyme, the reaction will be 10% faster, and if we double the enzyme concentration the reaction will proceed twice as fast. Thus there is a simple linear relationship between the reaction rate and the amount of enzyme available to catalyze the reaction (Figure 6.5). This relationship applies both to enzymes in vivo and to those used in biotechnological applications, where regulation of the amount of enzyme present may control reaction rates.
Figure 6.5 Relationship Between Enzyme Concentration and the Rate of an Enzyme-Catalyzed Reaction.
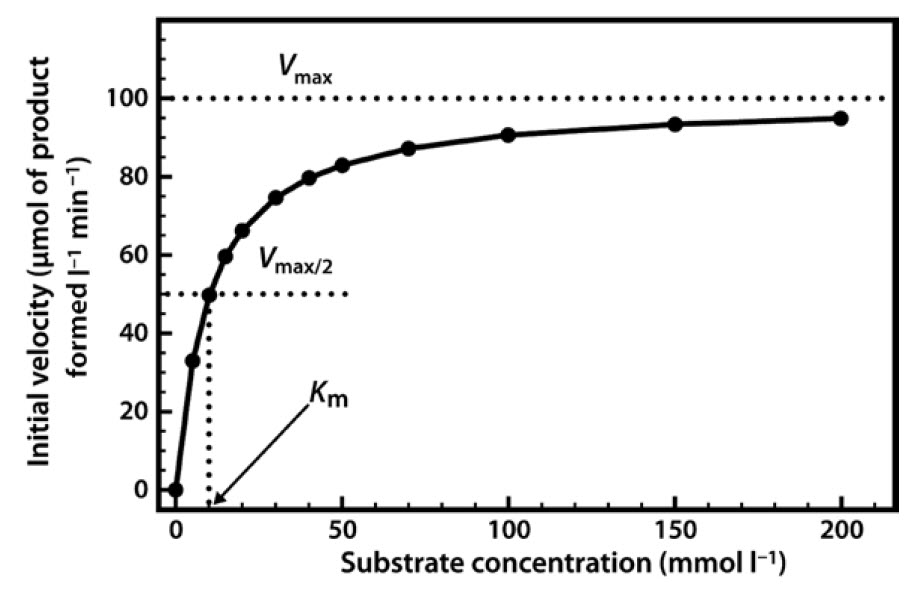
When we perform a series of enzyme assays using the same enzyme concentration, but with a range of different substrate concentrations, a slightly more complex relationship emerges, as shown in Figure 6. Initially, when the substrate concentration is increased, the rate of reaction increases considerably. However, as the substrate concentration is increased further the effects on the reaction rate start to decline, until a stage is reached where increasing the substrate concentration has little further effect on the reaction rate. At this point the enzyme is considered to be coming close to saturation with substrate, and demonstrating its maximal velocity (Vmax). Note that this maximal velocity is, in fact, a theoretical limit that will not be truly achieved in any experiment, although we might come very close to it.
Figure 6.6 Relationship Between Substrate Concentration and the Rate of an Enzyme-Catalyzed Reaction.
The relationship described here is a fairly common one, which a mathematician would immediately identify as a rectangular hyperbola. The equation that describes such a relationship is as follows:
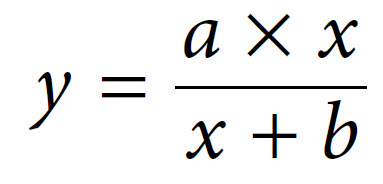 The two constants a and b thus allow us to describe this hyperbolic relationship, just as with a linear relationship (y = mx + c), which can be expressed by the two constants m (the slope) and c (the intercept). We have in fact already defined the constant a — it is Vmax. The constant b is a little more complex, as it is the value on the x-axis that gives half of the maximal value of y. In enzymology we refer to this as the Michaelis constant (Km), which is defined as the substrate concentration that gives half-maximal velocity.
Our final equation, usually called the Michaelis–Menten equation, therefore becomes:
 In 1913, Leonor Michaelis and Maud Menten first showed that it was in fact possible to derive this equation mathematically from first principles, with some simple assumptions about the way in which an enzyme reacts with a substrate to form a product. Central to their derivation is the concept that the reaction takes place via the formation of an ES complex which, once formed, can either dissociate (productively) to release product, or else dissociate in the reverse direction without any formation of product. Thus the reaction can be represented as follows, with k1, k−1 and k2 being the rate constants of the three individual reaction steps:
 The Michaelis–Menten derivation requires two important assumptions. The first assumption is that we are considering the initial velocity of the reaction (v0), when the product concentration will be negligibly small (i.e. [S] ≫ [P]), such that we can ignore the possibility of any product reverting to substrate. The second assumption is that the concentration of substrate greatly exceeds the concentration of enzyme (i.e. [S] ≫ [E]).
The derivation begins with an equation for the expression of the initial rate, the rate of formation of product, as the rate at which the ES complex dissociates to form product. This is based upon the rate constant k2 and the concentration of the ES complex, as follows:
 Since ES is an intermediate, its concentration is unknown, but we can express it in terms of known values. In a steady-state approximation we can assume that although the concentration of substrate and product changes, the concentration of the ES complex itself remains constant.
The rate of formation of the ES complex and the rate of its breakdown must therefore balance, where:
Rate of ES complex formation = Rate of ES complex breakdown
where:
![]() The equation can be rearranged to yield [ES] as follows:
The equation can be rearranged to yield [ES] as follows:
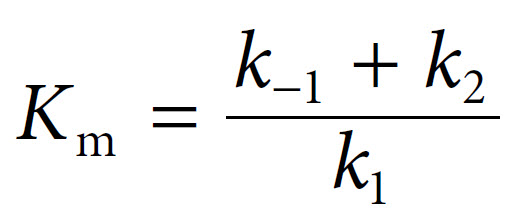
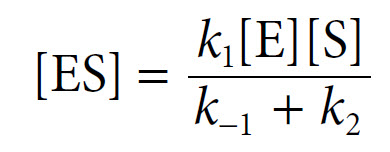 The Michaelis constant Km can be defined as follows:
The [ES] equation can then be simplified to:
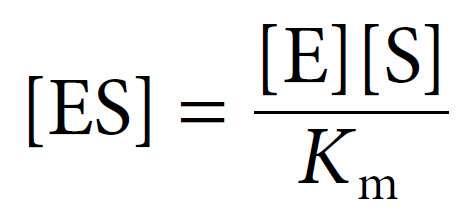 Since the concentration of substrate greatly exceeds the concentration of enzyme (i.e. [S] ≫ [E]), the concentration of uncombined substrate [S] is almost equal to the total concentration of substrate. The concentration of uncombined enzyme [E] is equal to the total enzyme concentration [E]T minus that combined with substrate [ES]. Introducing these terms to into the equation above and solving for ES gives us the following:
 We can then introduce this term for [ES] into the initial velocity equation above to yield:
 The term k2[E]T in fact represents Vmax, the maximal velocity. Thus Michaelis and Menten were able to derive their final equation as:
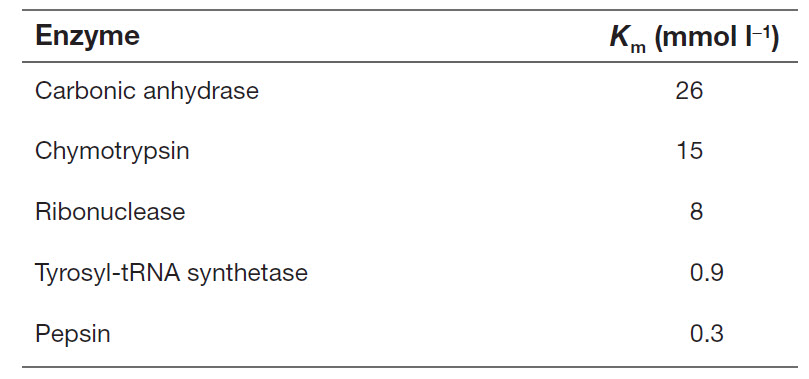
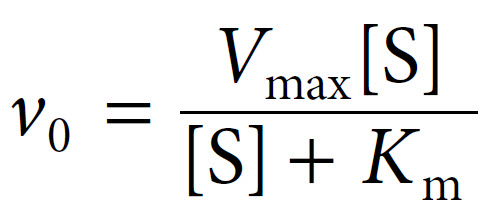 Michaelis constants have been determined for many commonly used enzymes, and are typically in the lower millimolar range (Table 6.5). It should be noted that enzymes which catalyse the same reaction, but which are derived from different organisms, can have widely differing Km values. Furthermore, an enzyme with multiple substrates can have quite different Km values for each substrate.
Table 6.5 Typical Range of Values of the Michaelis Constant
A low Km value indicates that the enzyme requires only a small amount of substrate in order to become saturated. Therefore the maximum velocity is reached at relatively low substrate concentrations. A high Km value indicates the need for high substrate concentrations in order to achieve maximum reaction velocity. Thus we generally refer to Km as a measure of the affinity of the enzyme for its substrate—in fact it is an inverse measure, where a high Km indicates a low affinity, and vice versa.
The Km value tells us several important things about a particular enzyme:
- An enzyme with a low Km value relative to the physiological concentration of substrate will probably always be saturated with substrate, and will therefore act at a constant rate, regardless of variations in the concentration of substrate within the physiological range.
- An enzyme with a high Km value relative to the physiological concentration of substrate will not be saturated with substrate, and its activity will therefore vary according to the concentration of substrate, so the rate of formation of product will depend on the availability of substrate.
- If an enzyme acts on several substrates, the substrate with the lowest Km value is frequently assumed to be that enzyme’s ‘natural’ substrate, although this may not be true in all cases.
- If two enzymes (with similar Vmax) in different metabolic pathways compete for the same substrate, then if we know the Km values for the two enzymes we can predict the relative activity of the two pathways. Essentially the pathway that has the enzyme with the lower Km value is likely to be the ‘preferred pathway’, and more substrate will flow through that pathway under most conditions. For example, phosphofructokinase (PFK) is the enzyme that catalyses the first committed step in the glycolytic pathway, which generates energy in the form of ATP for the cell, whereas glucose-1-phosphate uridylyltransferase (GUT) is an enzyme early in the pathway leading to the synthesis of glycogen (an energy storage molecule). Both enzymes use hexose monophosphates as substrates, but the Km of PFK for its substrate is lower than that of GUT for its substrate. Thus at lower cellular hexose phosphate concentrations, PFK will be active and GUT will be largely inactive. At higher hexose phosphate concentrations both pathways will be active. This means that the cells only store glycogen in times of plenty, and always give preference to the pathway of ATP production, which is the more essential function.
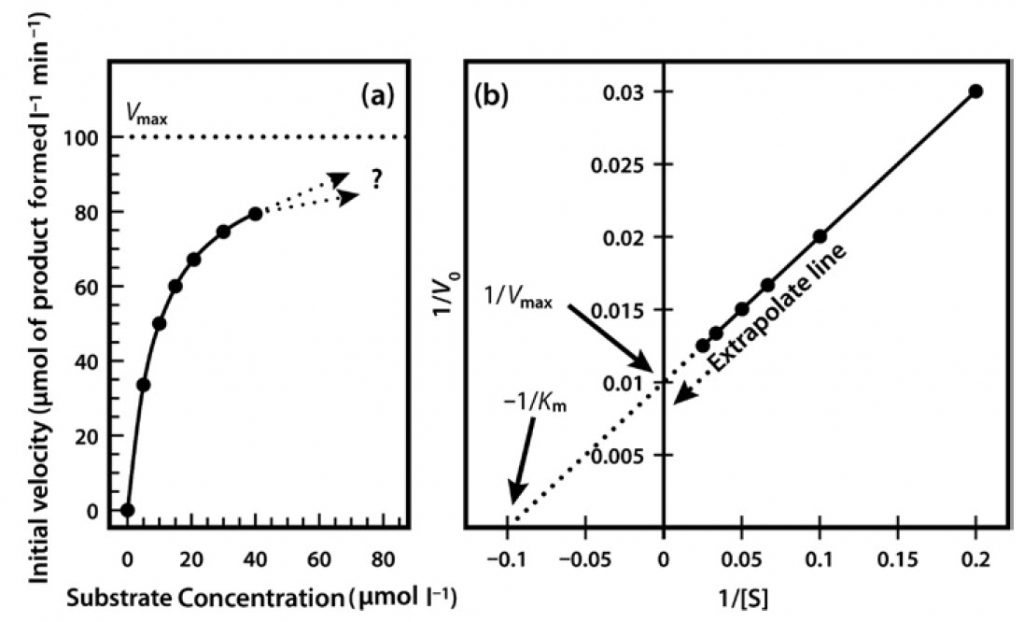
Very often it is not possible to estimate Km values from a direct plot of velocity against substrate concentration (as shown in Figure 6.6) because we have not used high enough substrate concentrations to come even close to estimating maximal velocity, and therefore we cannot evaluate half-maximal velocity and thus Km. Fortunately, we can plot our experimental data in a slightly different way in order to obtain these values. The most commonly used alternative is the Lineweaver–Burk plot (often called the double-reciprocal plot). This plot linearizes the hyperbolic curved relationship, and the line produced is easy to extrapolate, allowing evaluation of Vmax and Km.
For example, if we obtained only the first seven data points in Figure 6.6, we would have difficulty estimating Vmax from a direct plot as shown in Figure 6.7a. However, as shown in Figure 6.7b, if these seven points are plotted on a graph of 1/velocity against 1/substrate concentration (i.e. a double-reciprocal plot), the data are linearized, and the line can be easily extrapolated to the left to provide intercepts on both the y-axis and the
x-axis, from which Vmax and Km, respectively, can be evaluated.
Figure 6.7 Michaelis Menton Kinetics. (a) Direct plot of data (b) Lineweaver-Burk plot of the same kinetic data.
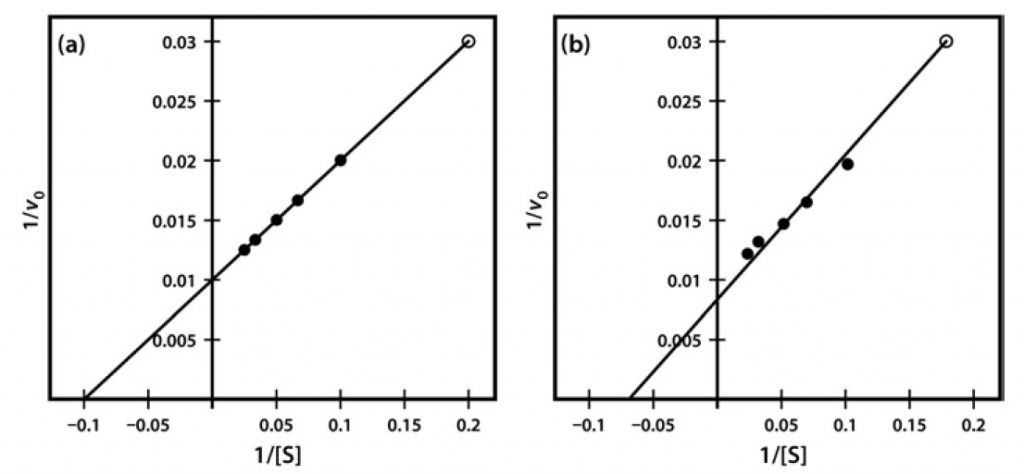
One significant practical drawback of using the Lineweaver–Burk plot is the excessive influence that it gives to measurements made at the lowest substrate concentrations. These concentrations might well be the most prone to error (due to difficulties in making multiple dilutions), and result in reaction rates that, because they are slow, might also be most prone to measurement error. Often, as shown in Figure 8, such points when transformed on the Lineweaver–Burk plot have a significant impact on the line of best fit estimated from the data, and therefore on the extrapolated values of both Vmax and Km. The two sets of points shown in Figure 8 are identical except for the single point at the top right, which reflects (because of the plot’s double-reciprocal nature) a single point derived from a very low substrate concentration and a low reaction rate. However, this single point can have an enormous impact on the line of best fit and the accompanying estimates of kinetic constants.
Figure 6.8 Lineweaver-Burk Plot of Similar Kinetic Data, Which Differ Only in a Single Data Point (Final data point (a) 1/v 0.03 at 1/S of 0.2 and (b) 1/v 0.031 at 1/S of 0.18).
In fact there are other kinetic plots that can be used, including the Eadie–Hofstee plot, the Hanes plot and the Eisenthal–Cornish-Bowden plot, which are less prone to such problems. In the enzyme kinetics homework, you will experiment with these other types of linearization techniques.
back to the top
6.6 Enzymes are Affected by pH and Temperature
Various environmental factors are able to affect the rate of enzyme-catalysed reactions through reversible or irreversible changes in the protein structure. The effects of pH and temperature are generally well understood.
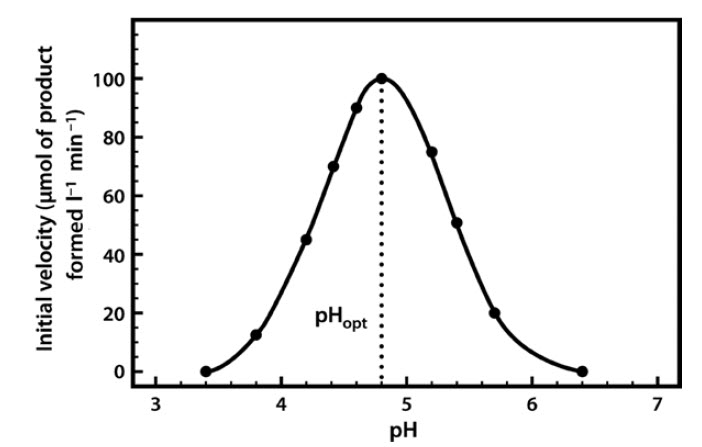
Most enzymes have a characteristic optimum pH at which the velocity of the catalyzed reaction is maximal, and above and below which the velocity declines (Figure 6.9).
Figure 6.9 The pH Profile of β-Glucosidase.
The pH profile is dependent on a number of factors. As the pH changes, the ionization of groups both at the enzyme’s active site and on the substrate can alter, influencing the rate of binding of the substrate to the active site. These effects are often reversible. For example, if we take an enzyme with an optimal pH (pHopt) of 7.0 and place it in an environment at pH 6.0 or 8.0, the charge properties of the enzyme and the substrate may be suboptimal, such that binding and hence the reaction rate are lowered. If we then readjust the pH to 7.0, the optimal charge properties and hence the maximal activity of the enzyme are often restored.
However, if we place the enzyme in a more extreme acidic or alkaline environment (e.g. at pH 1 or 14), although these conditions may not actually lead to changes in the very stable covalent structure of the protein’s primary structure (i.e. its configuration), they may well produce changes in the conformation (shape) of the protein such that, when it is returned to pH 7.0, the original conformation and hence the enzyme’s full catalytic activity are not restored. It should be noted that the optimum pH of an enzyme may not be identical to that of its normal intracellular surroundings. This indicates that the local pH can exert a controlling influence on enzyme activity.
The effects of temperature on enzyme activity are quite complex, and can be regarded as two forces acting simultaneously but in opposite directions. As the temperature is raised, the rate of molecular movement and hence the rate of reaction increases, but at the same time there is a progressive inactivation caused by denaturation of the enzyme protein. This becomes more pronounced as the temperature increases, so that an apparent temperature optimum (Topt) is observed (Figure 6.10).
Figure 6.10 The Effect of Temperature on Enzyme Activity.
Thermal denaturation is time dependent, and for an enzyme the term ‘optimum temperature’ has little real meaning unless the duration of exposure to that temperature is recorded. The thermal stability of an enzyme can be determined by first exposing the protein to a range of temperatures for a fixed period of time, and subsequently measuring its activity at one favorable temperature (e.g. 25°C).
The temperature at which denaturation becomes important varies from one enzyme to another. Normally it is negligible below 30°C, and starts to become appreciable above 40°C. Typically, enzymes derived from microbial sources show much higher thermal stability than do those from mammalian sources, and enzymes derived from extremely thermophilic microorganisms, such as thermolysin (a protease from Bacillus thermoproteolyticus) and Taq polymerase (a DNA polymerase from Thermus aquaticus), might be completely thermostable at 70°C and still retain substantial levels of activity even at 100°C.
back to the top
6.7 Enzymes are Sensitive to Inhibitors
Substances that reduce the activity of an enzyme-catalysed reaction are known as inhibitors. They act by either directly or indirectly influencing the catalytic properties of the active site. Inhibitors can be foreign to the cell or natural components of it. Those in the latter category can represent an important element of the regulation of cell metabolism. Many toxins and also many pharmacologically active agents (both illegal drugs and prescription and over-thecounter medicines) act by inhibiting specific enzyme-catalysed processes.
-
Reversible inhibition
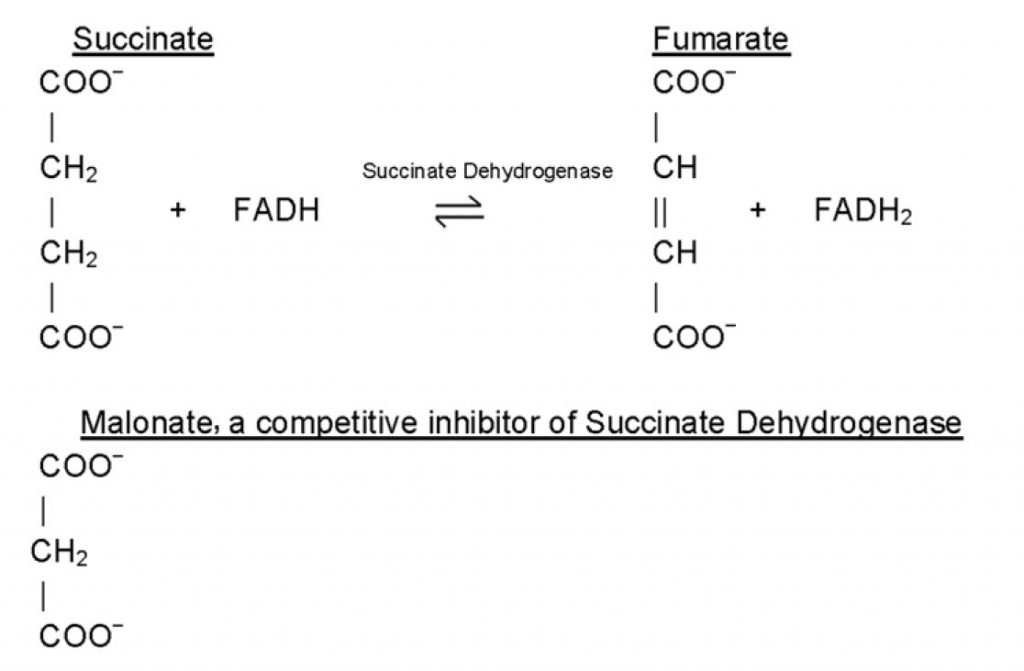
Inhibitors are classified as reversible inhibitors when they bind reversibly to an enzyme. A molecule that is structurally similar to the normal substrate may be able to bind reversibly to the enzyme’s active site and therefore act as a competitive inhibitor. (Figure 6.11) For example, malonate is a competitive inhibitor of the enzyme succinate dehydrogenase, as it is capable of binding to the enzyme’s active site due to its close structural similarity to the enzyme’s natural substrate, succinate (see below). When malonate occupies the active site of succinate dehydrogenase it prevents the natural substrate, succinate, from binding, thereby slowing down the rate of oxidation of succinate to fumarate (i.e. inhibiting the reaction).
One of the characteristics of competitive inhibitors is that they can be displaced from the active site if high concentrations of substrate are used, thereby restoring enzyme activity. Thus competitive inhibitors increase the Km of a reaction because they increase the concentration of substrate required to saturate the enzyme. However, they do not change Vmax itself.
In the case of certain enzymes, high concentrations of either the substrate or the product can be inhibitory. For example, invertase activity is considerably reduced in the presence of high concentrations of sucrose (its substrate), whereas the β-galactosidase of Aspergillus niger is strongly inhibited by galactose (its product). Products of an enzyme reaction are some of the most commonly encountered competitive inhibitors.

Figure 6.11 Competitive Inhibition. Competitive inhibition occurs when substrate (S) and inhibitor (I) both bind to the same site on the enzyme. In effect, they compete for the active site and bind in a mutually exclusive fashion.
Figure by Henry Jakubowski
Other types of reversible inhibitor also exist. Non-competitive inhibitors react with the enzyme at a site distinct from the active site. Therefore the binding of the inhibitor does not physically block the substrate binding site, but it does prevent subsequent reaction. Most noncompetitive inhibitors are chemically unrelated to the substrate, and their inhibition cannot be overcome by increasing the substrate concentration. Such inhibitors in effect reduce the concentration of the active enzyme in solution, thereby reducing the Vmax of the reaction. However, they do not change the value of Km.
Figure 6.12 Noncompetitive Inhibition. Nonompetitive inhibition occurs when the inhibitor (I) binds to the enzyme at a site that is distant from that of the substrate. In effect, the noncompetitive inhibitor alters the conformation of the enzyme, such that it has reduced or limited function as a catalyst.
Figure by Henry Jakubowski
Uncompetitive inhibition is rather rare, occurring when the inhibitor is only able to bind to the enzyme once a substrate molecule has itself bound. As such, inhibition is most significant at high substrate concentrations, and results in a reduction in the Vmax of the reaction. Uncompetitive inhibition also causes a reduction in Km, which seems somewhat counterintuitive as this means that the affinity of the enzyme for its substrate is actually increased when the inhibitor is present. This effect occurs because the binding of the inhibitor to the ES complex effectively removes ES complex and thereby affects the overall equilibrium of the reaction favoring ES complex formation. It is noteworthy however that since both Vmax and Km are reduced the observed reaction rates with inhibitor present are always lower than those in the absence of the uncompetitive inhibitor.
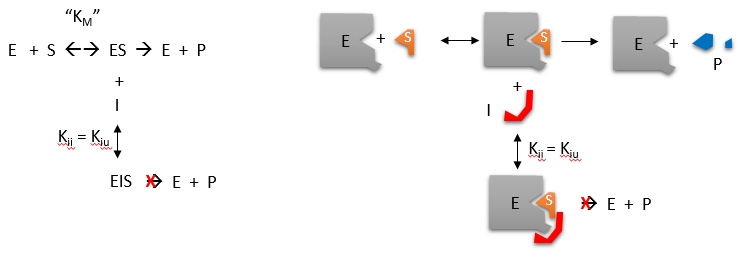
Figure 6.13 Uncompetitive Inhibition. In uncompetitive inhibition, the inhibitor binds to the ES complex of the reaction and blocks the enzyme’s ability to complete the reaction.
Figure by Henry Jakubowski
The effects of reversible inhibitors can be easily identified using the Lineweaver-Burk diagram as shown in Figure 6.14.
Figure 6.14 Lineweaver-Burk Plots of Reversible Inhibitors. Uninhibited enzyme profiles shown in red, whereas reactions where inhibitors are incrementally present are shown in green. (A) competitive inhibition, (B) noncompetitive inhibition, and (C) uncompetitive inhibition.
Figure modified from Henry Jakubowski
-
Irreversible Inhibitors and Poisons
If an inhibitor binds permanently to an enzyme it is known as an irreversible inhibitor. Many irreversible inhibitors covalently attach to the enzymes that they inhibit causing their structure to be permanently altered. Thus, many irreversible inhibitors are therefore potent toxins.
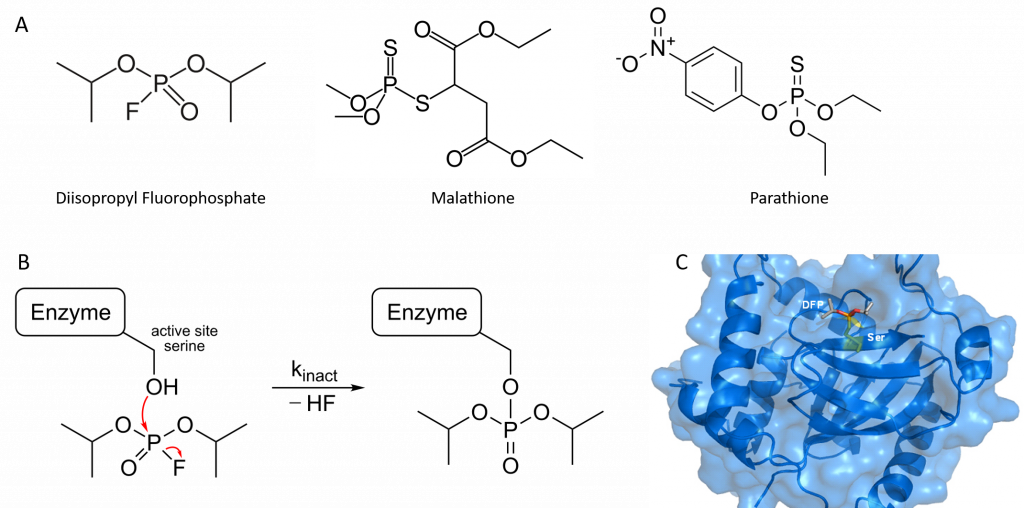
Organophosphorus compounds such as diisopropyl fluorophosphate (DFP) inhibit acetylcholinesterase activity by reacting covalently with an important serine residue found within the active site of the enzyme. The physiological effect of this inactivation is interference with neurotransmitter inactivation at the synapses of nerves, resulting in the constant propagation of nerve impulses, which can cause muscle convulsions and lead to death. DFP was originally evaluated by the British as a chemical warfare agent during World War II, and modified versions of this compound are now widely used as organophosphate pesticides, including parathione and malathione (Figure 6.15). Notably DFP is also a potent inhibitor of the protease enzyme from the Herpes Simplex Virus and has been used to study the active site dynamics of this protein (Figure 6.15). Many drugs also act as irreversible inhibitors, including the β-lactam antibiotics like penicillin.
Figure 6.15 Organophosphates are Irreversible Inhibitors. (A) Structure of diisopropyl fluorophosphate (DFP), malathione and parathione, (B) Irreversible inhibition of enzymes by DFP through the covalent modification of an active site serine residue, and (C) Crystal structure of Herpes Simplex Virus Protease/Inhibitor (DFP) complex. The active site serine (yellow) has undergone phosphonylation resulting in irreversible inhibition. Rendered from PDB 1AT3.
Image (B) by Hb878 and Image (C) by MattyJenJen
back to the top
6.8 Allosteric Regulators and the Control of Enzyme Activity
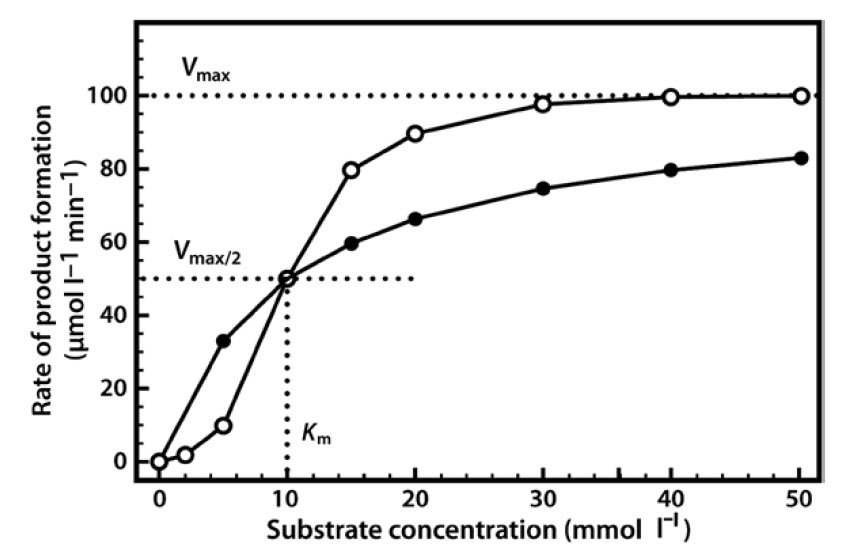
Having spent time learning about enzyme kinetics and the Michaelis–Menten relationship, it is often quite disconcerting to find that some of the most important enzymes do not in fact display such properties. Allosteric enzymes are key regulatory enzymes that control the activities of metabolic pathways by responding to inhibitors and activators. These enzymes in fact show a sigmoidal (S-shaped) relationship between reaction rate and substrate concentration (Figure 6.16), rather than the usual hyperbolic relationship. Thus for allosteric enzymes there is an area where activity is lower than that of an equivalent ‘normal’ enzyme, and also an area where activity is higher than that of an equivalent ‘normal’ enzyme, with a rapid transition between these two phases. This is rather like a switch that can quickly be changed from ‘off’ (low activity) to ‘on’ (full activity).
Figure 6.16 Activity/Substrate Profiles of Allosteric (open circles) and Non-allosteric (solid circles) Enzymes with the Same Affinity and Maximal Velocity.
Most allosteric enzymes are polymeric—that is, they are composed of at least two (and often many more) individual polypeptide chains. They also have multiple active sites where the substrate can bind. Much of our understanding of the function of allosteric enzymes comes from studies of hemoglobin (Hb) which, although it is not an enzyme, binds oxygen in a similarly co-operative way and thus also demonstrates this sigmoidal relationship. Allosteric enzymes have an initially low affinity for the substrate, but when a single substrate molecule binds, this may break some bonds within the enzyme and thereby change the shape of the protein such that the remaining active sites are able to bind with a higher affinity. Therefore allosteric enzymes are often described as moving from a tensed state or T-state (low affinity) in which no substrate is bound, to a relaxed state or R-state (high affinity) as substrate binds. Other molecules can also bind to allosteric enzymes, at additional regulatory sites (i.e. not at the active site). Molecules that stabilize the protein in its T-state therefore act as allosteric inhibitors, whereas molecules that move the protein to its R-state will act as allosteric activators or promoters.
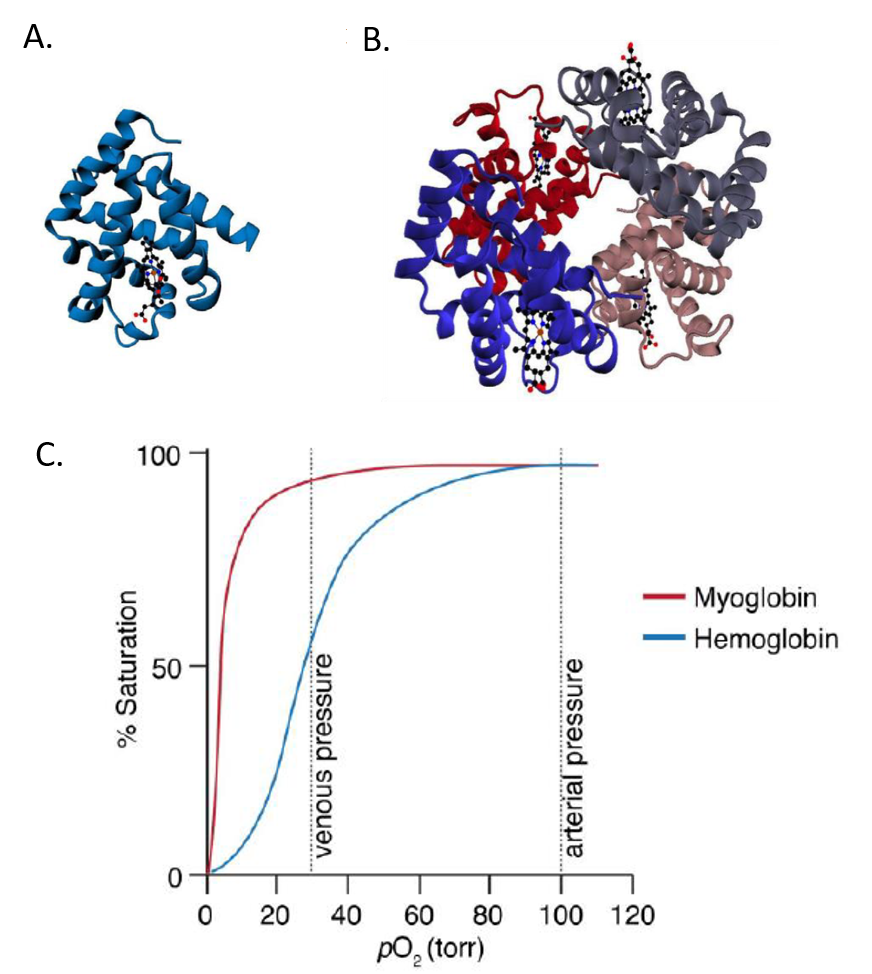
Hemoglobin is a tetrameric protein made up of two alpha subunits and two beta subunits. It is homologous with the monomeric oxygen-binding protein, myoglobin. As seen in Figure 6.17, oxygen binding to myoglobin gives a standard hyperbolic profile, whereas hemoglobin shows sigmoidal oxygen binding. The sigmoidal kinetic profile of hemoglobin indicates that oxygen binding is cooperative or that the binding of one oxygen to one subunit, increases the likelihood that oxygen will bind at another subunit.
Figure 6.17 Comparison of Myoglobin (A) and Hemoglobin (B) Structures and (C) Binding Kinetics with Oxygen.
Image by O’Reilly Science Art for MIT OpenWare
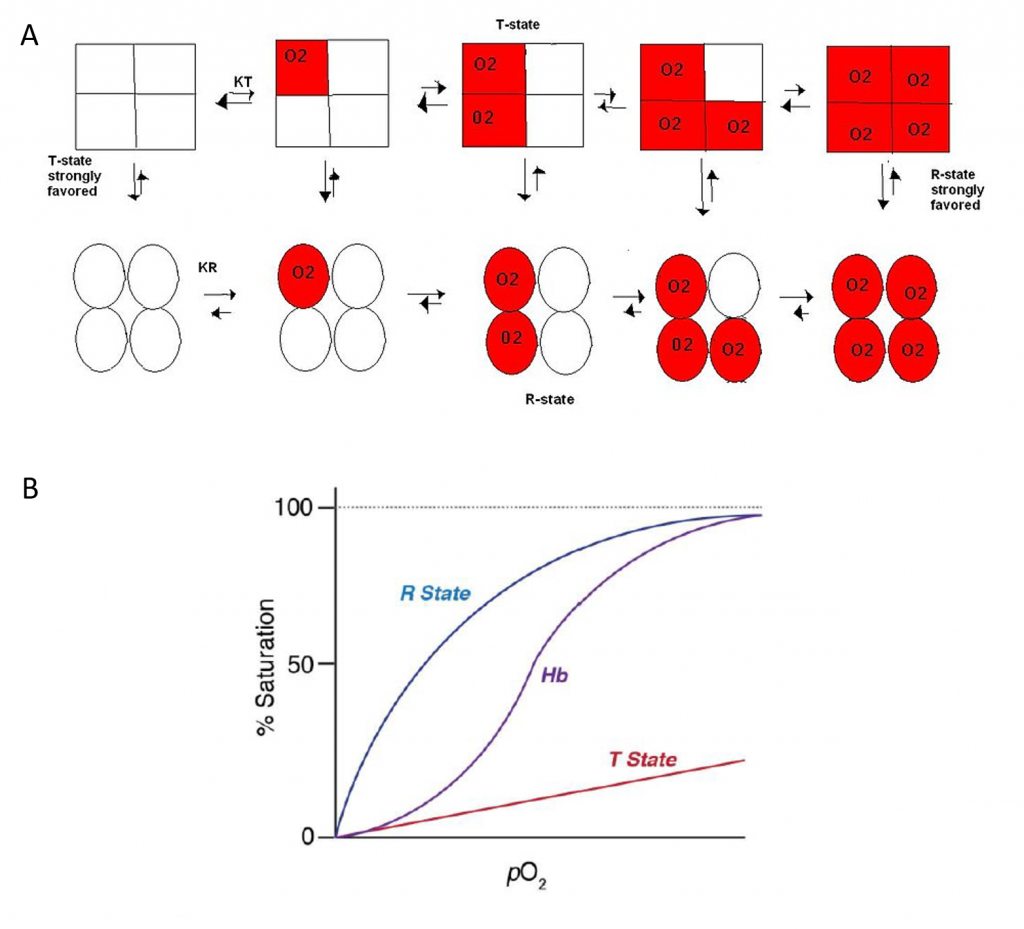
The Concerted Model, also known as the symmetry model, of hemoglobin is used to explain the cooperativity in oxygen binding as well as the transitions of proteins which are made up of identical subunits. It focuses on the two states of the Hemoglobin; the T and R states. The T state of the hemoglobin is more tense as it is in the deoxyhemoglobin form while the R state of the hemoglobin is more relaxed as it is in the oxyhemglobin form. T state is constrained due to the subunit-subunit interactions while the R state is more flexible due to the ability of oxygen binding. The difference in deoxyhemoglobin and oxyhemoglobin is that the “deoxy” form doesn’t have oxygen and the “oxy” form is highly oxygen bound. The binding of oxygen at one site increases or facilitates the binding affinity in other active sites. Thus, a sigmoidal curve is observed for the oxygen binding kinetics of hemoglobin. As seen in Figure 6.18, in the concerted model of the hemoglobin, it shows that the one oxygen binding to an active site will increase the probability of other oxygen binding to the other active sites in the hemoglobin. This ability is known as cooperativity or cooperative binding. Overall, oxygen binding shifts the equilibrium toward the R state. This means that at high oxygen levels, the R form will be prevalent and at lower oxygen levels, the T form will be prevalent. Allosteric effectors of hemoglobin, such as 2,3- bisphosphoglycerate (2,3-BPG), function by shifting the equilibrium towards or away from the T-state, depending on whether it’s an allosteric inhibitor or allosteric promoter. This model displays the extreme cases of R and T transitions. In a real system, properties from both models are needed to explain the behavior of hemoglobin.
Figure 6.18 Dynamics of Oxygen Binding in Hemoglobin. As shown in (A) above, the tense-state (T-state) of hemoglobin is favored when oxygen binding is low. The tetramer shifts from the T-state to the relaxed-state (R-state) with oxygen binding. In fact, the binding of one oxygen with one subunit increases the liklihood of oxygen binding with other subunits, known as cooperativity. (B) shows the graphic representation of Hemoglobin (Hb) binding to oxygen which transitions between the T-state and R-state.
Image (A) by CPriest and Image (B) by O’Reilly Science Art for MIT OpenCourseWare
-
The Bohr Effect
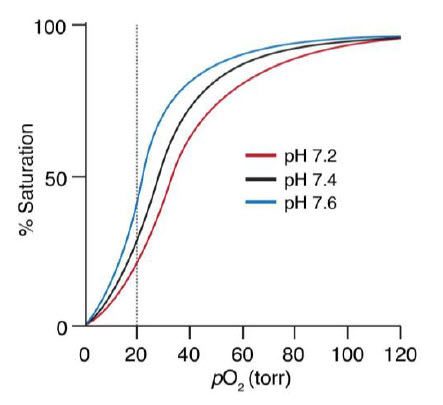
The Bohr effect is a physiological phenomenon first described in 1904 by the Danish physiologist Christian Bohr: hemoglobin’s oxygen binding affinity is inversely related both to acidity and to the concentration of carbon dioxide. The diagram below shows the effect of pH on O2 binding to Hb. The experimental observation is that at pH 7.2 and 20 torr, more O2 is unloaded than at pH 7.6 (Figure 6.19).
Figure 6.19 Hemoglobin Oxygen Binding is Dependent on pH.
Image by O’Reilly Science Art for MIT OpenWare
To think about the basis of this pH effect, recall three important factors: (1) CO2/HCO3– exist in equilibrium within biological systems and can effect the overall pH, (2) deoxyHb is a stronger base than O2•Hb, and (3) in red blood cells (RBCs), there is an enzyme called carbonic anhydrase, which catalyzes the hydration of CO2 by water to form HCO3– .

The equations above can be used to describe how hemoglobin maximizes unloading of O2 in the tissues and unloading of CO2 in the lungs.
First example: In muscle during exercise, glucose is converted to CO2. The CO2 then diffuses to the capillaries and RBCs and equilibrates to H+ and HCO3–. Some of the side chains of Hb act as a buffer. The H+s bind to deoxyHb and thus shift the equilibrium to the right, releasing more O2.
Second example: The deoxyHb is transported through the circulatory system back to the lungs where it picks up O2. O2 shifts the equilibrium to the left generating H+. The protons then react with HCO3– to generate CO2 and H2O. The CO2 is exhaled.
Overall, analysis of the biological activity of hemoglobin shows that regulation of a single protein’s activity is complex and can differ at different locations within the body or when exposed to allosteric effectors.
back to the top
6.9 Origin, Purification, and Uses of Enzymes
-
Enzymes are Ubiquitous
Enzymes are essential components of animals, plants and microorganisms, due to the fact that they catalyze and co-ordinate the complex reactions of cellular metabolism. Up until the 1970s, most of the commercial application of enzymes involved animal and plant sources. At that time, bulk enzymes were generally only used within the food-processing industry, and enzymes from animals and plants were preferred, as they were considered to be free from the problems of toxicity and contamination that were associated with enzymes of
microbial origin. However, as demand grew and as fermentation technology developed, the competitive cost of microbial enzymes was recognized and they became more widely used. Compared with enzymes from plant and animal sources, microbial enzymes have economic, technical and ethical advantages, which will now be outlined.


