Home » Student Resources » Online Chemistry Textbooks » CH450 and CH451: Biochemistry - Defining Life at the Molecular Level » Chapter 3: Investigating Proteins
MenuCH450 and CH451: Biochemistry - Defining Life at the Molecular Level
Chapter 3: Investigating Proteins
3.1 Protein Purification
3.2 Protein Identification and Visualization
3.3 Protein Synthesis and Sequencing
3.4 Protein Structure Elucidation
3.5 Proteome Analysis
3.6 References
3.1 Protein Purification
Protein purification is a series of processes intended to isolate one or a few proteins from a complex mixture, usually cells, tissues or whole organisms. Protein purification is vital for the characterization of the function, structure and interactions of the protein of interest. The purification process may separate the protein and non-protein parts of the mixture, and finally separate the desired protein from all other proteins. Separation of one protein from all others is typically the most laborious aspect of protein purification. Separation steps usually exploit differences in protein size, physico-chemical properties, binding affinity and biological activity. The pure result may be termed protein isolate.
Protein purification is either preparative or analytical. Preparative purifications aim to produce a relatively large quantity of purified proteins for subsequent use. Examples include the preparation of commercial products such as enzymes (e.g. lactase), nutritional proteins (e.g. soy protein isolate), and certain biopharmaceuticals (e.g. insulin). Several preparative purifications steps are often deployed to remove bi-products, such as host cell proteins, which poses as a potential threat to the patient’s health. Analytical purification produces a relatively small amount of a protein for a variety of research or analytical purposes, including identification, quantification, and studies of the protein’s structure, post-translational modifications and function. Pepsin and urease were the first proteins purified to the point that they could be crystallized.
Extraction
If the protein of interest is not secreted by the organism into the surrounding solution, the first step of each purification process is the disruption of the cells containing the protein. Depending on how fragile the protein is and how stable the cells are, one could, for instance, use one of the following methods: i) repeated freezing and thawing, ii) sonication, iii) homogenization by high pressure (French press), iv) homogenization by grinding (bead mill), and v) permeabilization by detergents (e.g. Triton X-100) and/or enzymes (e.g. lysozyme). Finally, the cell debris can be removed by centrifugation so that the proteins and other soluble compounds remain in the supernatant.
Also proteases are released during cell lysis, which will start digesting the proteins in the solution. If the protein of interest is sensitive to proteolysis, it is recommended to proceed quickly, and to keep the extract cooled, to slow down the digestion. Alternatively, one or more protease inhibitors can be added to the lysis buffer immediately before cell disruption. Sometimes it is also necessary to add DNAse in order to reduce the viscosity of the cell lysate caused by a high DNA content.
Precipitation and Differential Solubilization
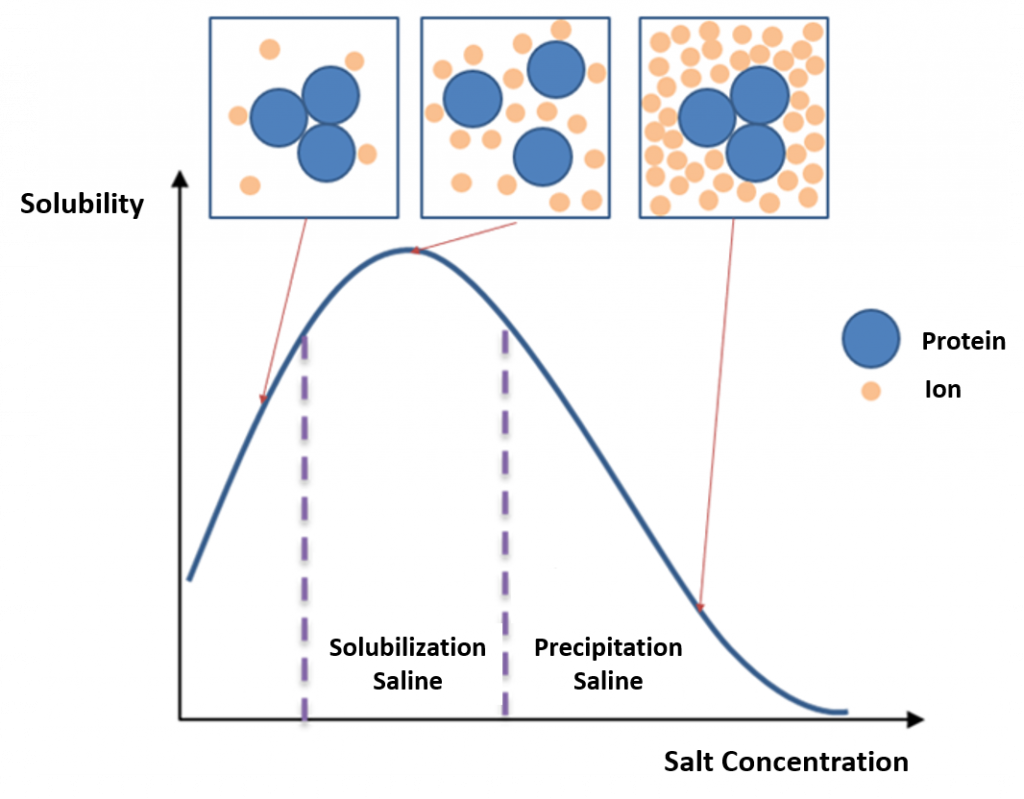
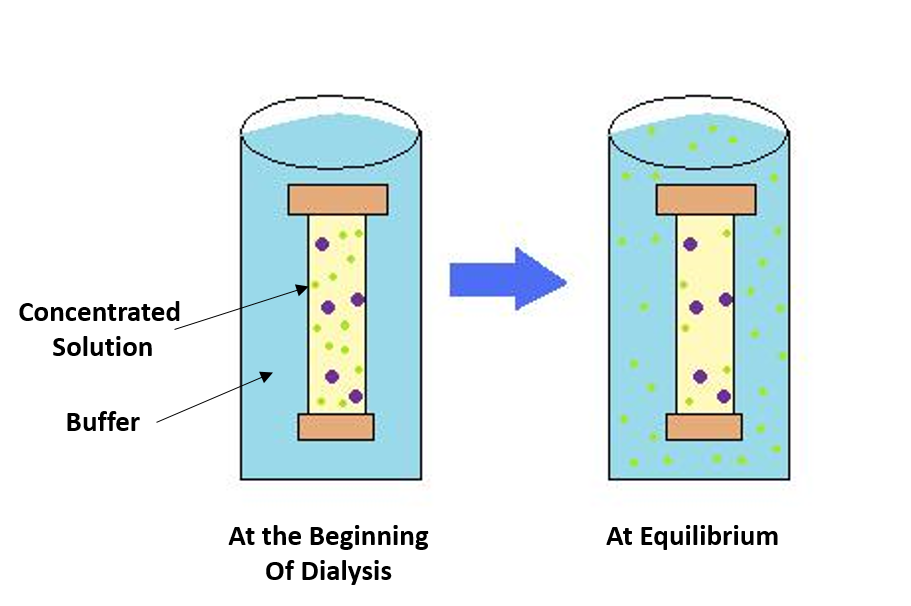
In bulk protein purification, a common first step to isolate proteins is precipitation using a salt such as ammonium sulfate (NH4)2SO4. This process is called Salting In or Salting Out (Figure 3.1) This is performed by adding increasing amounts of ammonium sulfate and collecting the different fractions of precipitate protein. Ammonium sulfate is often used as it is highly soluble in water, has relative freedom from temperature effects and typically is not harmful to most proteins. Furthermore, ammonium sulfate can be removed by dialysis (Figure 3.2). The hydrophobic groups on the proteins get exposed to the atmosphere, attract other protein hydrophobic groups and get aggregated. Protein precipitated will be large enough to be visible. One advantage of this method is that it can be performed inexpensively with very large volumes.
Figure 3.1 Salting In and Salting Out. During the salting in process, salt molecules increase the solubility of proteins by reducing the electrostatic interactions between protein molecules. As the salt concentration is increased, protein-protein interactions become more energetically favorable than protein-solvent interactions and the proteins precipitate from solution.
Image derived from Michel Awkal
The first proteins to be purified are water-soluble proteins. Purification of integral membrane proteins requires disruption of the cell membrane in order to isolate any one particular protein from others that are in the same membrane compartment. Sometimes a particular membrane fraction can be isolated first, such as isolating mitochondria from cells before purifying a protein located in a mitochondrial membrane. A detergent such as sodium dodecyl sulfate (SDS) can be used to dissolve cell membranes and keep membrane proteins in solution during purification; however, because SDS causes denaturation, milder detergents such as Triton X-100 or CHAPS can be used to retain the protein’s native conformation during complete purification.
Figure 3.2 Dialysis. The process of dialysis separates dissolved molecules by their size. The biological sample is placed inside a closed membrane, where the protein of interest is too large to pass through the pores of the membrane, but through which smaller ions can easily pass. As the solution comes to equilibrium, the ions become evenly distributed throughout the entire solution, while the protein remains concentrated in the membrane. This reduces the overall salt concentration of the suspension.
Image adapted from Gjk003
Ultracentrifugation
Centrifugation is a process that uses centrifugal force to separate mixtures of particles of varying masses or densities suspended in a liquid. When a vessel (typically a tube or bottle) containing a mixture of proteins or other particulate matter, such as bacterial cells, is rotated at high speeds, the inertia of each particle yields a force in the direction of the particles velocity that is proportional to its mass. The tendency of a given particle to move through the liquid because of this force is offset by the resistance the liquid exerts on the particle. The net effect of “spinning” the sample in a centrifuge is that massive, small, and dense particles move outward faster than less massive particles or particles with more “drag” in the liquid. When suspensions of particles are “spun” in a centrifuge, a “pellet” may form at the bottom of the vessel that is enriched for the most massive particles with low drag in the liquid.
Non-compacted particles remain mostly in the liquid called “supernatant” and can be removed from the vessel thereby separating the supernatant from the pellet. The rate of centrifugation is determined by the angular acceleration applied to the sample, typically measured in comparison to the g. If samples are centrifuged long enough, the particles in the vessel will reach equilibrium wherein the particles accumulate specifically at a point in the vessel where their buoyant density is balanced with centrifugal force. Such an “equilibrium” centrifugation can allow extensive purification of a given particle.
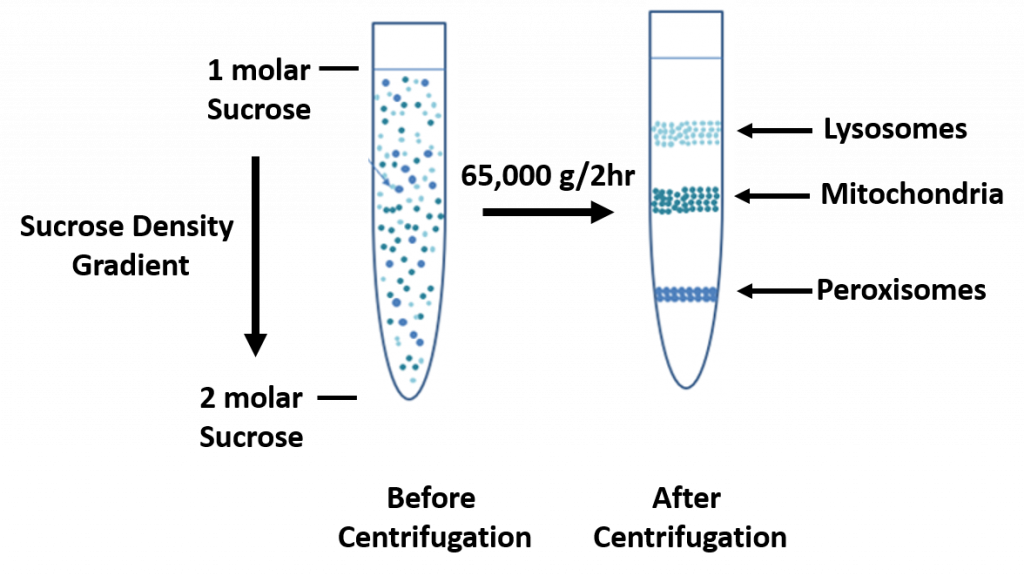
In sucrose gradient centrifugation, a linear concentration gradient of sugar (typically sucrose, glycerol, or a silica based density gradient media, like Percoll) is generated in a tube such that the highest concentration is on the bottom and lowest on top. Percoll is a trademark owned by GE Healthcare companies. A protein sample is then layered on top of the gradient and spun at high speeds in an ultracentrifuge. This causes heavy macromolecules to migrate towards the bottom of the tube faster than lighter material. During centrifugation in the absence of sucrose, as particles move farther and farther from the center of rotation, they experience more and more centrifugal force (the further they move, the faster they move). The problem with this is that the useful separation range of within the vessel is restricted to a small observable window. A properly designed sucrose gradient will counteract the increasing centrifugal force so the particles move in close proportion to the time they have been in the centrifugal field. Samples separated by these gradients are referred to as “rate zonal” centrifugations. After separating the protein/particles, the gradient is then fractionated and collected.
Figure 3.3 Sucrose Density Gradient.
Image derived from Michel Awkal
back to the top
Purification Strategy
Choice of a starting material is key to the design of a purification process. In a plant or animal, a particular protein usually isn’t distributed homogeneously throughout the body; different organs or tissues have higher or lower concentrations of the protein. Use of only the tissues or organs with the highest concentration decreases the volumes needed to produce a given amount of purified protein. If the protein is present in low abundance, or if it has a high value, scientists may use recombinant DNA technology to develop cells that will produce large quantities of the desired protein (this is known as an expression system). Recombinant expression allows the protein to be tagged, e.g. by a His-tag or Strep-tag to facilitate purification, reducing the number of purification steps required. These techniques will be discussed in greater detail in Chapter 5.
An analytical purification generally utilizes three properties to separate proteins. First, proteins may be purified according to their isoelectric points by running them through a pH graded gel or an ion exchange column. Second, proteins can be separated according to their size or molecular weight via size exclusion chromatography or by SDS-PAGE (sodium dodecyl sulfate-polyacrylamide gel electrophoresis) analysis. Proteins are often purified by using 2D-PAGE and are then analysed by peptide mass fingerprinting to establish the protein identity. This is very useful for scientific purposes and the detection limits for protein are nowadays very low and nanogram amounts of protein are sufficient for their analysis. Thirdly, proteins may be separated by polarity/hydrophobicity via high performance liquid chromatography or reversed-phase chromatography. Gel electrophoresis techniques are discussed in more detail in Section 3.2. This section will focus predominantly on chromatographic separations.
For preparative protein purification, the purification protocol generally contains one or more chromatographic steps. The basic procedure in chromatography is to flow the solution containing the protein through a column packed with various materials. Different proteins interact differently with the column material, and can thus be separated by the time required to pass the column, or the conditions required to elute the protein from the column. Usually proteins are detected as they are coming off the column by their absorbance at 280 nm. Many different chromatographic methods exist, with the most common described below:
Size Exclusion Chromatography (also known as Gel Filtration Chromatography)
Chromatography can be used to separate protein in solution or under denaturing conditions by using porous gels. This technique is known as size exclusion chromatography. The principle is that smaller molecules have to traverse a larger volume in a porous matrix. Consequentially, proteins of a certain range in size will require a variable volume of eluent (solvent) before being collected at the other end of the column of gel. Thus, proteins will be separated based on their size (Figure 3.4).
In the context of protein purification, the eluent is usually pooled in different test tubes. All test tubes containing no measurable trace of the protein to purify are discarded. The remaining solution is thus made of the protein to purify and any other similarly-sized proteins.

Figure 3.4 Size Exclusion Chromatography. Also known as Gel Filtration Chromatography, is a low resolution isolation method that involves the use of beads that have tiny “tunnels” in them that each have a precise size. The size is referred to as an “exclusion limit,” which means that molecules above a certain molecular weight will not fit into the tunnels. Molecules with sizes larger than the exclusion limit do not enter the tunnels and pass through the column relatively quickly by making their way between the beads. Smaller molecules, which can enter the tunnels, do so, and thus, have a longer path that they take in passing through the column. Because of this, molecules larger than the exclusion limit will leave the column earlier, while smaller molecules that pass through the beads will elute from the column later. This method allows separation of molecules by their size.
Image from Dr. Kevin Ahern and Indira Rajagopal
Hydrophobic Interaction Chromatography (HIC)
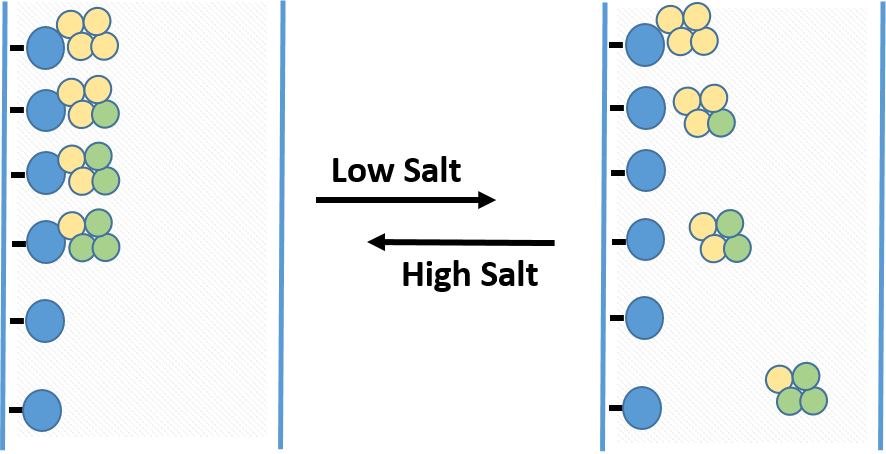
HIC media is amphiphilic, with both hydrophobic and hydrophilic regions, allowing for separation of proteins based on their surface hydrophobicity. Target proteins and their product aggregate species tend to have different hydrophobic properties and removing them via HIC further purifies the protein of interest. Additionally, the environment used typically employs less harsh denaturing conditions than other chromatography techniques, thus helping to preserve the protein of interest in its native and functional state. In pure water, the interactions between the resin and the hydrophobic regions of protein would be very weak, but this interaction is enhanced by applying a protein sample to HIC resin in high ionic strength buffer. The ionic strength of the buffer is then reduced to elute proteins in order of decreasing hydrophobicity (Figure 3.5).
Figure 3.5 Hydrophobic Interaction Chromatography. The column matrix, shown in blue has a hydrophobic ligand covalently attached. In high salt conditions, proteins will bind to the matrix with differing affinity, with more hydrophobic proteins (shown in yellow) binding more tightly than more hydrophilic proteins (shown in green) When the salt concentration is decreased, proteins that are more hydrophilic will be released first, followed more hydrophobic proteins.
Ion Exchange Chromatography
Ion exchange chromatography separates compounds according to the nature and degree of their ionic charge. The column to be used is selected according to its type and strength of charge. Anion exchange resins have a positive charge and are used to retain and separate negatively charged compounds (anions), while cation exchange resins have a negative charge and are used to separate positively charged molecules (cations).
Before the separation begins a buffer is pumped through the column to equilibrate the opposing charged ions. Upon injection of the sample, solute molecules will exchange with the buffer ions as each competes for the binding sites on the resin. The length of retention for each solute depends upon the strength of its charge. The most weakly charged compounds will elute first, followed by those with successively stronger charges. Because of the nature of the separating mechanism, pH, buffer type, buffer concentration, and temperature all play important roles in controlling the separation.
Figure 3.6 demonstrates a type of ion exchange column known as a cation exchange column. In this case, the support consists of tiny beads to which are attached chemicals possessing a charge. Each charged molecule has a counter-ion. The figure shows the beads (blue) with negatively charged groups (red) attached. In this example, the counter-ion is sodium, which is positively charged. The negatively charged groups are unable to leave the beads, due to their covalent attachment, but the counter- ions can be “exchanged” for molecules of the same charge. Thus, a cation exchange column will have positively charged counter-ions and positively charged compounds present in a mixture passed through the column will exchange with the counter-ions and “stick” to the negatively charged groups on the beads. Molecules in the sample that are neutral or negatively charged will pass quickly through the column. On the other hand, in anion exchange chromatography, the chemical groups attached to the beads are positively charged and the counter-ions are negatively charged. Molecules in the sample that are negatively charged will “stick” and other molecules will pass through quickly. To remove the molecules “stuck” to a column, one simply needs to add a high concentration of the appropriate counter-ions to displace and release them. This method allows the recovery of all components of the mixture that share the same charge.
Ion exchange chromatography is a very powerful tool for use in protein purification and is frequently used in both analytical and preparative separations.

Figure 3.6 Cation Exchange Chromatography. In this diagram the negatively charged molecules (shown in red) are covalently attached to the column matrix beads (shown in blue). Sodium ions (Na+) are the counter ions that are replaced by positively charged proteins within the protein mixture. Neutral and negatively charged proteins do not stick and will pass through the column. The positively charged proteins can then be eluted from the column by adding higher concentrations of the counter ion (in this case the sodium ions).
Image from Kevin Ahern and Indira Rajagopal
Affinity Chromatography is a separation technique based upon molecular conformation, which frequently utilizes application specific resins. These resins have ligands (small molecules) attached to their surfaces which are specific for and will bind with the compounds to be separated. Most frequently, these ligands function in a fashion similar to that of antibody-antigen interactions. This “lock and key” fit between the ligand and its target compound makes it highly specific, frequently generating a single peak, while all else in the sample is unretained (Figure 3.7).
For example, many membrane proteins are glycoproteins and can be purified by lectin affinity chromatography. Detergent-solubilized proteins can be allowed to bind to a chromatography resin that has been modified to have a covalently attached lectin. Proteins that do not bind to the lectin are washed away and then specifically bound glycoproteins can be eluted by adding a high concentration of a sugar that competes with the bound glycoproteins at the lectin binding site. Some lectins have high affinity binding to oligosaccharides of glycoproteins that is hard to compete with sugars, and bound glycoproteins need to be released by denaturing the lectin.

Figure 3.7 Example of Affinity Chromatography. In this example, protein P1 has affinity for ligand Z and will bind to the column while proteins P2 and P3 will pass through the column. Protein P1 can then be eluted from the column using high concentrations of free ligand Z.
A common technique involves engineering a sequence of 6 to 8 histidine residues into the N- or C-terminal of a recombinant protein. The polyhistidine binds strongly to divalent metal ions such as nickel and cobalt. The protein can be passed through a column containing immobilized nickel ions, which binds the polyhistidine tag. All untagged proteins pass through the column. The protein can be eluted with imidazole, which competes with the polyhistidine tag for binding to the column, or by a decrease in pH (typically to 4.5), which decreases the affinity of the tag for the resin. While this procedure is generally used for the purification of recombinant proteins with an engineered affinity tag (such as a 6xHis tag), it can also be used for natural proteins with an inherent affinity for divalent cations.
Immunoaffinity chromatography
A special type of affinity chromatography is Immunoaffinity chromatography (Figure 3.8). This technique uses the specific binding of an antibody with its antigen (target molecule that the antibody will bind with selectively) to purify the protein of interest. The procedure involves immobilizing an antibody to a solid substrate (e.g. a porous bead or a membrane), which then selectively binds the target, while everything else flows through. The target protein can be eluted by changing the pH or the salinity. The immobilized ligand can be an antibody (such as Immunoglobulin G) or it can be a protein (such as Protein A). Because this method does not involve engineering in a tag, it can be used for proteins from natural sources. Antibody structure and their use in protein identification will be discussed in greater detail in Section 3.2.
Figure 3.8. An Antigen Immunoprecipitation Experiment. The antibody is either pre-immobilized to a solid support (left) or immobilized using antibody binding proteins after incubation with the sample (right). Immobilization allows the immune complex to be extracted from the complex sample, washed and eluted providing a high enrichment of the protein under investigation
Image from The Human Atlas Project
back to the top
High Performance Liquid Chromatography (HPLC) and Fast Protein Liquid Chromatography (FPLC)
High performance liquid chromatography or high pressure liquid chromatography (HPLC) is a form of chromatography applying high pressure to drive the solutes through the column faster. This means that the diffusion is limited and the resolution is improved. The most common form is “reversed phase” HPLC, where the column material is hydrophobic. The proteins are eluted by a gradient of water and increasing amounts of an organic solvent, such as acetonitrile. The proteins elute according to their hydrophobicity. After purification by HPLC the protein is in a solution that only contains volatile compounds, and can easily be lyophilized (freeze dried). HPLC purification frequently results in denaturation of the purified proteins and is thus not applicable to proteins that do not spontaneously refold.
Due to the drawbacks of HPLC, an alternative technique using a lower pressure system was developed and is called Fast protein liquid chromatography (FPLC). FPLC is a form of liquid chromatography that is often used to analyze or purify mixtures of proteins. As in other forms of chromatography, separation is possible because the different components of a mixture have different affinities for two materials, a moving fluid (the “mobile phase”) and a porous solid (the stationary phase). In FPLC the mobile phase is an aqueous solution, or “buffer”. The buffer flow rate is controlled by a positive-displacement pump and is normally kept constant, while the composition of the buffer can be varied by drawing fluids in different proportions from two or more external reservoirs. The stationary phase is a resin composed of beads, usually of cross-linked agarose, packed into a cylindrical glass or plastic column. FPLC resins are available in a wide range of bead sizes and surface ligands depending on the application.
In the most common FPLC strategy, an ion exchange resin is typically chosen (Figure 3.9). A mixture containing one or more proteins of interest is dissolved in 100% buffer A and pumped into the column. The proteins of interest bind to the resin while other components are carried out in the buffer. The total flow rate of the buffer is kept constant; however, the proportion of Buffer B (the “elution” buffer) is gradually increased from 0% to 100% according to a programmed change in concentration (the “gradient”). Buffer B contains high concentrations of the exchanger ion. Thus as the concentration of the Buffer B gradually increases, bound proteins will dissociate depending on their ionic interactions with the column matrix and appear in the eluant. The eluant passes through two detectors which measure salt concentration (by conductivity) and protein concentration (by absorption of ultraviolet light at a wavelength of 280nm). As each protein is eluted it appears in the eluant as a “peak” in protein concentration and can be collected for further use.
FPLC was developed and marketed in Sweden by Pharmacia in 1982 and was originally called fast performance liquid chromatography to contrast it with HPLC or high-performance liquid chromatography. FPLC is generally applied only to proteins; however, because of the wide choice of resins and buffers it has broad applications. In contrast to HPLC the buffer pressure used is relatively low, typically less than 5 bar, but the flow rate is relatively high, typically 1-5 ml/min. FPLC can be readily scaled from analysis of milligrams of mixtures in columns with a total volume of 5 ml or less to industrial production of kilograms of purified protein in columns with volumes of many liters.

Figure 3.9 Typical FPLC System. A. Scheme of basic compounents and typical flow path for a chromatography system. B. Picrue of GE Healthcare AKTA FPLC apparatus.
Image provided by LaVerde, V., Dominici, P. and Astegno, A. (2017) Bio-protocol 7(8): e2230.
Purification Scheme
During the protein purification process it is necessary to have a quantitative system to determine how much protein has been purified, what concentration the protein represents from the original mixture, how biologically active the purified protein is, and the overall purity of the protein. This will help guide and optimize the purification method being developed. Ineffective separation techniques can be disregarded and other techniques that give higher yield or that retain biologically activity of the protein can be adopted.
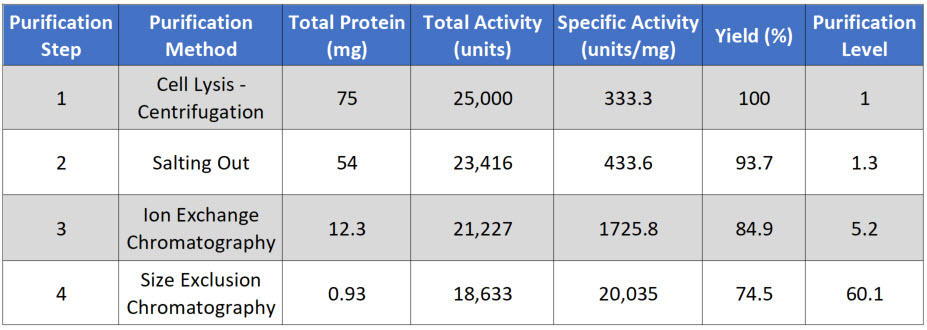
Thus, each step in the purification scheme is quantitatively evaluated for the following parameters: total protein, total activity, specific activity, yield, purification level. Each of these parameters will be defined within the sample protocol given below.
Pretend you are a researcher that wants to isolate a novel, unknown protein from a bacterial culture. You grow 500 ml of the bacteria overnight at 37oC and harvest the bacteria by centrifugation. You remove the culture broth and retain the bacterial pellet. You then lyse the bacteria using freeze/thaw in 10 mL of reaction buffer. You then centrifuge the lysed bacteria to remove the insoluble materials and retain the supernatent that contains the soluble proteins. Your protein of interest has a biological activity that you can measure using a simple assay that causes a color change in the reaction mixture (Figure 3.10). You also note that this reaction rate increases with increasing concentrations of your protein supernatent (Figure 3.10)

Figure 3.10. Example of a Chemical Reaction that causes a color change from orange to brown depending on increasing concentration.
Image from: Ludwig, N., et. al. (2015) on Research Gate
At this point, you can measure your baseline concentrations for the first purification level (bacterial lysis and removal of insoluble proteins and other cellular debris by centrifugation).
Total Protein is calculated by measuring the concentration in a fraction of your sample, and then multiplying that by the total volume of your sample. In this case, you are starting with 10 mL of supernatent. In a typical assay to measure protein concentration, you will use 50 – 200 μL of sample to determine the protein concentration. For example, if you calculate that there is 7.5 μg/μL in your initial assay, you would need to convert that value into mg/mL and then multiply it by 10 mL for a total of 75 mg of protein in 10 mL of supernatant (Table 3.1)
Total Activity is measured as the enzyme activity within the assay, multiplied by the total volume of the sample. For example, in the initial sample, you might use 5 to 50 μL of sample in your biological reaction (Figure 3.10). If you calculated the activity in your assay to be 2.5 units/μL, this would be equivalent to 2,500 units/mL or 25,000 units/10 mL of supernatant. Note that, the enzyme unit, or international unit for enzyme (symbol U, sometimes also IU) is a unit of enzyme’s catalytic activity. 1 U (μmol/min) is defined as the amount of the enzyme that catalyzes the conversion of one micromole of substrate per minute under the specified conditions of the assay method.
Specific Activity is measured by dividing the Total Activity by the Total Protein. In our example, 25,000 units divided by 75 mg of protein = 333.3 units/mg.
Yield is a measure of the biological activity retained in the sample after each purification step. The amount in the first step is set to be 100%. All subsequent yield steps will be evaluated using the first purification step. It is calculated by dividing the total activity of the current step, by the total activity of the first step and then multiplying by 100.
Purification level evaluates the purity of the protein of interest by dividing the specific activity calculated after each purification step by the specific activity of the first purification step. Thus, the first step always has a value of 1.
Table 3.1 Typical Protein Purification Scheme
Note that after each purification step that the Total Protein goes down, as you are purifying your protein away from other proteins in the mixture. Total Activity also goes down with each purification step, as some of your protein of interest is also lost at each purification step, because (1) some protein will stick to the test tubes and glassware, (2) some protein won’t bind with 100% efficiency to your column matrix, (3) some protein may bind too tightly to be removed from the column matrix during elution, and (4) some protein may be denatured or degraded during the purification process.
The amount of your protein of interest that is lost is represented within the overall percent yield for each purification step. If the percent yield is too low alternative purification methods should be explored.
Note that in a good protein purification scheme that the specific activity should go up substantially with each level of purification as the amount of your protein of interest makes up a greater percentage of the total protein within that fraction. If the specific activity only increases modestly within a purification step, or if it decreases during a purification step, this could indicate that (1) your protein of interest is being substantially lost at that step, (2) that your protein of interest is being denatured or degraded and is no longer biologically active, or (3) that a required cofactor or binding protein is being reduced at that purification step. Additional experiments may need to be conducted to determine which of the causes predominates, so that steps can be taken to reduce protein inactivation. For example, many proteins are temperature sensitive and will degrade or denature at room temperature. Completing purification steps on ice can often reduce degradation.
Overall, the fold increase in purification level should increase exponentially during the purification process. Note that in our example, if after 4 steps of purification our proteins is close to 95% pure, this would indicate that our protein of interest makes up approximately 1.24% of the total protein within the sample.
back to the top
3.2 Protein Identification and Visualization
Analytical techniques that can be used to positively identify or visualize a protein of interest within a mixture can also be a valuable tool to understanding the biological activity and significance of a protein within a living system and can also be used to help guide protein purification schemes.
Gel Electrophoresis
(work derived from Magdeldin, S.)
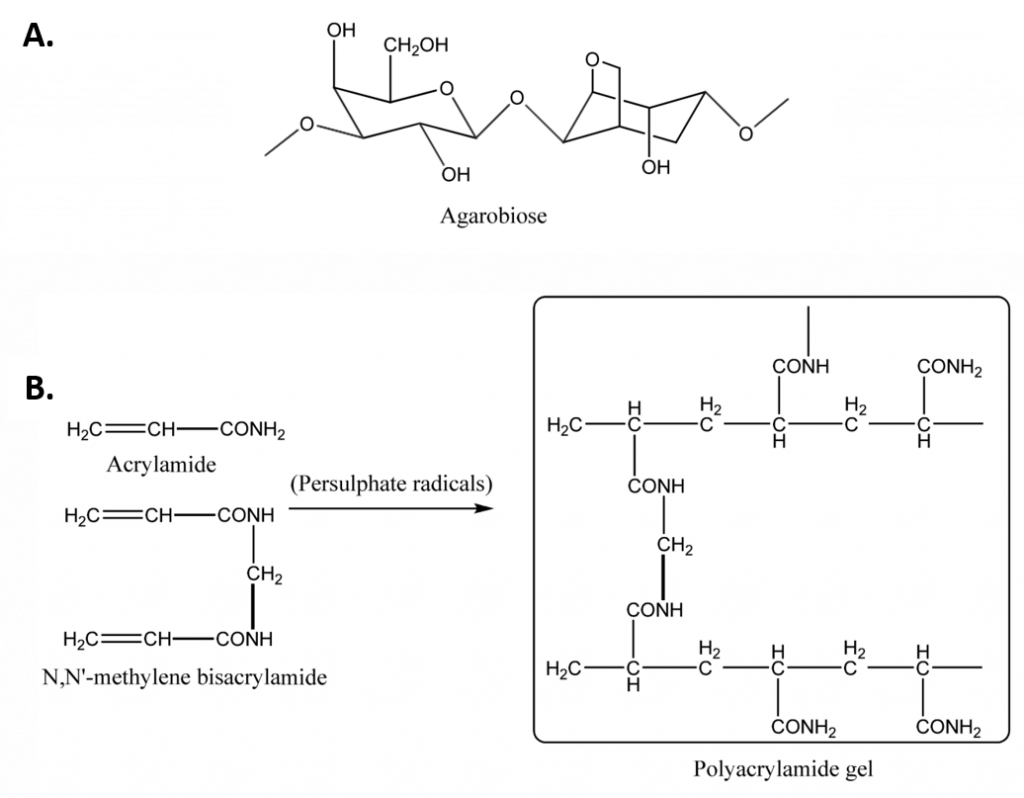
Agarose is a natural linear polymer extracted from seaweed that forms a gel matrix by hydrogen-bonding when heated in a buffer and allowed to cool. For most applications, only a single-component agarose is needed and no polymerization catalysts are required (Figure 3.11). Therefore, agarose gels are simple and rapid to prepare. They are the most popular medium for the separation of moderate and large-sized nucleic acids and have a wide range of separation but a relatively low resolving power, since the bands formed in the gels tend to be fuzzy and spread apart. This is a result of pore size and cannot be largely controlled. These and other advantages and disadvantages of using agarose gels for electrophoresis are summarized in Table 3.2. Agarose gels are not typically used for protein samples and won’t be discussed in this chapter further. However, they will be revisted in Chapter 5 covering nucleic acid techniques.
Table 3.2. Advantages and Disadvantages of Agarose Gel Electrophoresis.
Polyacrylamide gels are chemically cross-linked gels formed by the polymerization of acrylamide with a cross-linking agent, usually N,N’-methylenebisacrylamide (Figure 3.11). The reaction is a free radical polymerization, usually carried out with ammonium persulfate as the initiator and N,N,N’,N’-tetramethylethylendiamine (TEMED) as the catalyst. Although the gels are generally more difficult to prepare and handle, involving a longer time for preparation than agarose gels, they have major advantages over agarose gels. They have a greater resolving power, can accommodate larger quantities of sample without significant loss in resolution and the purity of the sample recovered from polyacrylamide gels is extremely high. Moreover, the pore size of the polyacrylamide gels can be altered in an easy and controllable fashion by changing the concentrations of the two monomers. Thus, it is commonly used to separate proteins and smaller fragments of DNA. It should be noted that polyacrylamide is a neurotoxin (when unpolymerized), but with proper laboratory care it is no more dangerous than various commonly used chemicals. Some advantages and disadvantages of using polyacrylamide gels for electrophoresis are depicted in Table 3.3.
Table 3.3. Advantages and Disadvantages of Polyacrylamide Gel Electrophoresis.
Hydrated gel networks have many desirable properties for electrophoresis. They allow a wide variety of mechanically stable experimental formats such as horizontal/vertical electrophoresis in slab gels or electrophoresis in tubes or capillaries. The mechanical stability also facilitates post electrophoretic manipulation making further experimentation possible such as blotting, electro-elution or mass spectral identification /finger printing of intact proteins or of proteins digested in gel slices. Since gels used in biochemistry are chemically rather unreactive, they interact minimally with biomolecules during electrophoresis allowing separation based on physical rather than chemical differences between sample components.
Figure 3.11 Gels Commonly Used in Electrophoresis. (A) Agarose is composed of agarbiose, (B) The polymerization of acrylamide and bisacrylamide to form polyacrylamide gel. The polymerization reaction is initiated by persulfate radicals and catalyzed by TEMED.
Image from Magdeldin, S.
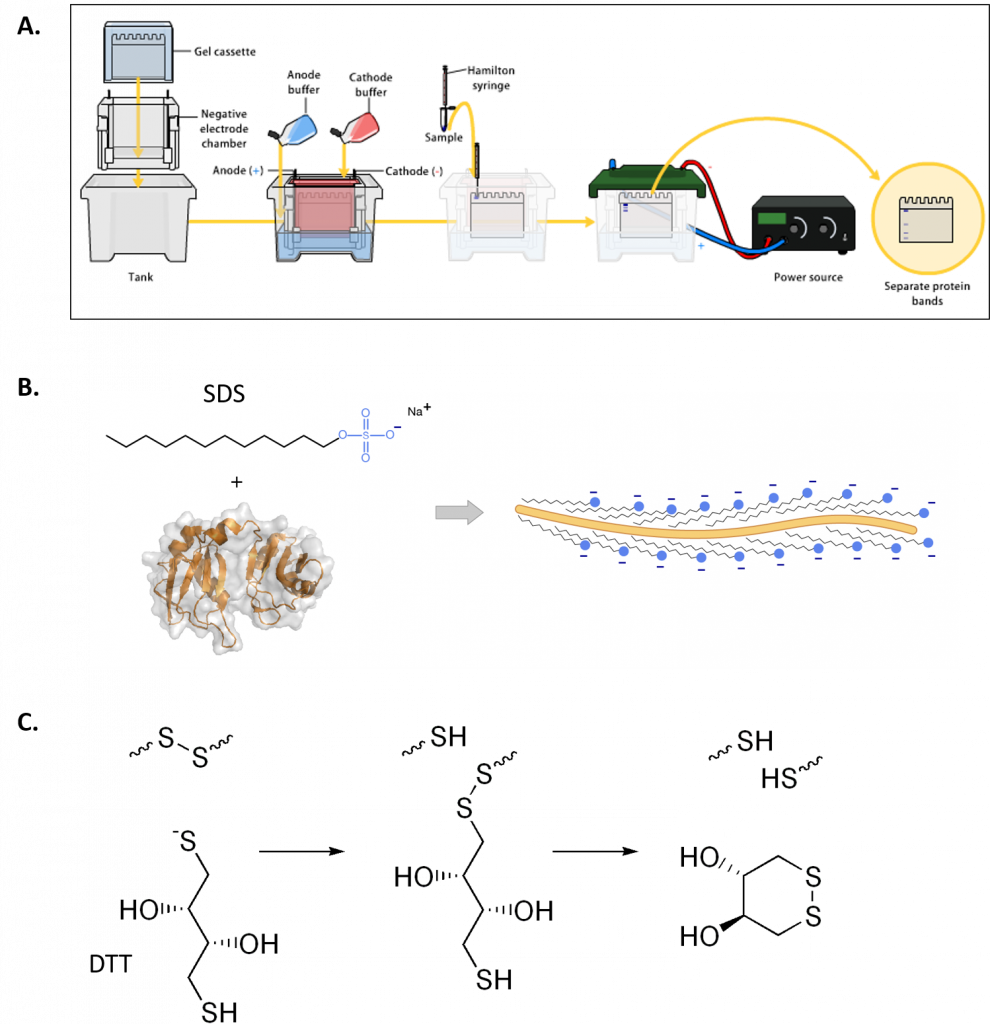
Gel electrophoresis of proteins with a polyacrylamide matrix, commonly called polyacrylamide gel electrophoresis (PAGE) is undoubtedly one of the most widely used techniques to characterize complex protein mixtures. It is a convenient, fast and inexpensive method because they require only the order of micrograms quantities of protein. They are usually run in a vertical format and the gel rigs contain an upper and lower buffer reservoir (Fig. 3.12A). The samples are loaded in wells that contact the upper buffer reservoir which will house the negative cathode. The proteins migrate towards the positive anode when the electric current is applied.
Note that proteins have a net electrical charge if they are in a medium having a pH different from their isoelectric point and therefore have the ability to move when subjected to an electric field. The migration velocity is proportional to the ratio between the charges of the protein and its mass. The higher charge per unit of mass the faster the migration.
Proteins do not have a predictable structure as nucleic acids, and thus their rates of migration are not similar to each other. Furthermore, they will not migrate when applying an electromotive force, when the pH of the system is the same as isoelectric point. PAGE gels that are run in this fashion are called Native PAGE, as the proteins are still folded in their native state found in vivo. In this situation, proteins migrate according to their charge, size and shape.
Alternatively, proteins may be denatured prior to electrophoresis. The most common way to denature the proteins is by adding a detergent such as sodium dodecyl sulfate (SDS) (Fig 3.12B). This not only denatures the proteins, but it also coats the protein with a negative charge, such that all of the proteins will run towards the positive lead when placed into an electric field. This type of electrophoresis is referred to as SDS-PAGE and separates proteins exclusively according to molecular weight. A reducing agent that breaks disulfide bonds, such as dithiothreitol (DTT) is often added to the loading buffer as well, causing proteins to fully denature and dissociate into the monomer subunits (Fig 3.12C). This ensures that the proteins migrate through the gel in direct relation to their size, rather than by charge or shape.
Figure 3.12 Polyacrylamide Gel Electrophoresis (PAGE). (A) Shows a typical set up for PAGE. A vertical gel is placed into a rig with an upper and lower buffer reservoir. The upper reservoir contains the gel wells where the protein is loaded and will house the cathode (negative charge). The proteins will run towards the anode (positive charge) when an electric field is placed on the system, in relation to the protein size, shape and charge. (B) Sodium dodecyl sulfate (SDS) is often used to denature proteins prior to PAGE analysis, causing proteins to migrate based on size only. (C) Reducing agents, such as dithiothreitol (DTT) are often used in combination with SDS, to ensure that disulfide bonds within the protein or between protein subunits are fully reduced to free cysteine residues.
Figures from: (A) Bensaccount (B) Fdardel, and (C) Edgar181
Detection of Proteins in Gels
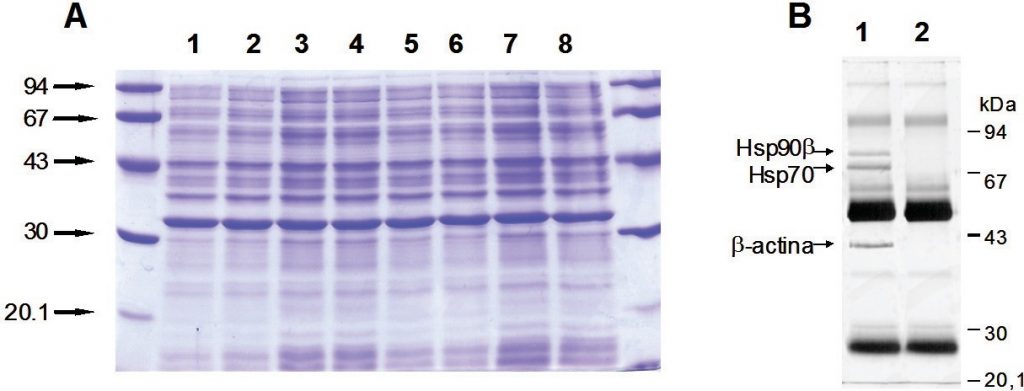
Proteins separated on a polyacrylamide gel can be detected by various methods, for instance dyes and silver staining (Figure 3.13).
- Dyes
The Coomassie blue staining allows detecting up to 0.2 to 0.6 µg of protein, and is quantitative (linear) up to 15 to 20 µg. It is often used in methanol-acetic acid solutions and is discolored in isopropanol-acetic acid solutions (Fig. 1 A). For staining of 2-DE gels it is recommended to remove ampholytes by adding trichloroacetic (TCA) to the dye and subsequently discolor with acetic acid.
- Silver staining
It is an alternative to routine staining protein gels (as well as nucleic acids and lipopolysaccharides) because its ease use and high sensitivity (50 to 100 times more sensitive than Coomassie blue staining) (Fig. 1 B). This staining technique is particularly suitable for two-dimensional gels.
- Detection of radioactive proteins by autoradiography
The autoradiography is a detection technique of radioactively labeled molecules that uses photographic emulsions sensitive to radioactive particles or light produced by an intermediate molecule. The emulsion containing silver is sensitive to particulate radiation (alpha, beta) or electromagnetic radiation (gamma, light…), so that it precipitates as metallic silver. The emulsion will develop as dark precipitates in the region in which radioactive proteins are detected.
Figure 3.13. SDS-PAGE. Proteins separated on SDS-PAGE and detected by Coomassie blue (A) and silver staining (B). Standards of proteins to know molecular weight are also loaded at edges.
Image from Magdeldin, S.
Isoelectric Focusing
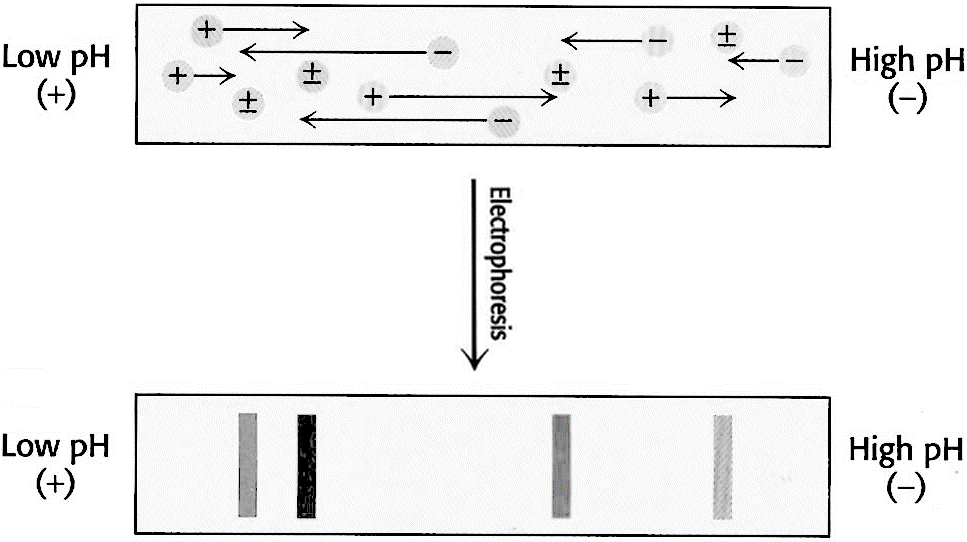
This technique is based on the movement of molecules in a pH gradient. Amphoteric molecules such as amino acids and proteins are separated in an environment where there is a difference of potential and pH gradient. The region of the anode (+) is acidic and the cathode (-) is alkaline. Between them down a pH gradient such that the molecules to be separated have their isoelectric point within the range. Substances that are initially in regions with a pH below its isoelectric point are positively charged and migrate towards the cathode, while those that are in media with pH lower than its pI will have negative charge and migrate towards the anode (Figure 3.14). The migration will lead to a region where the pH coincide with its pI, have a zero net charge (form zwitterions) and stop. Thus amphoteric molecules are located in narrow bands where the pI coincides with the pH. In this technique the point of application is not critical as molecules will always move to their pI region. The stable pH gradient between the electrodes is achieved using a mixture of low molecular weight ampholytes which pI covers a preset range of pH.
Figure 3.14. Isoelectric Focusing. A pH gradient is established in a gel before loading the sample. After the sample is loaded a voltage is applied. The protein will migrate to their isoelectric pH, which they have no net charge.
Image from Magdeldin, S.
Two-Dimensional Gel Electrophoresis
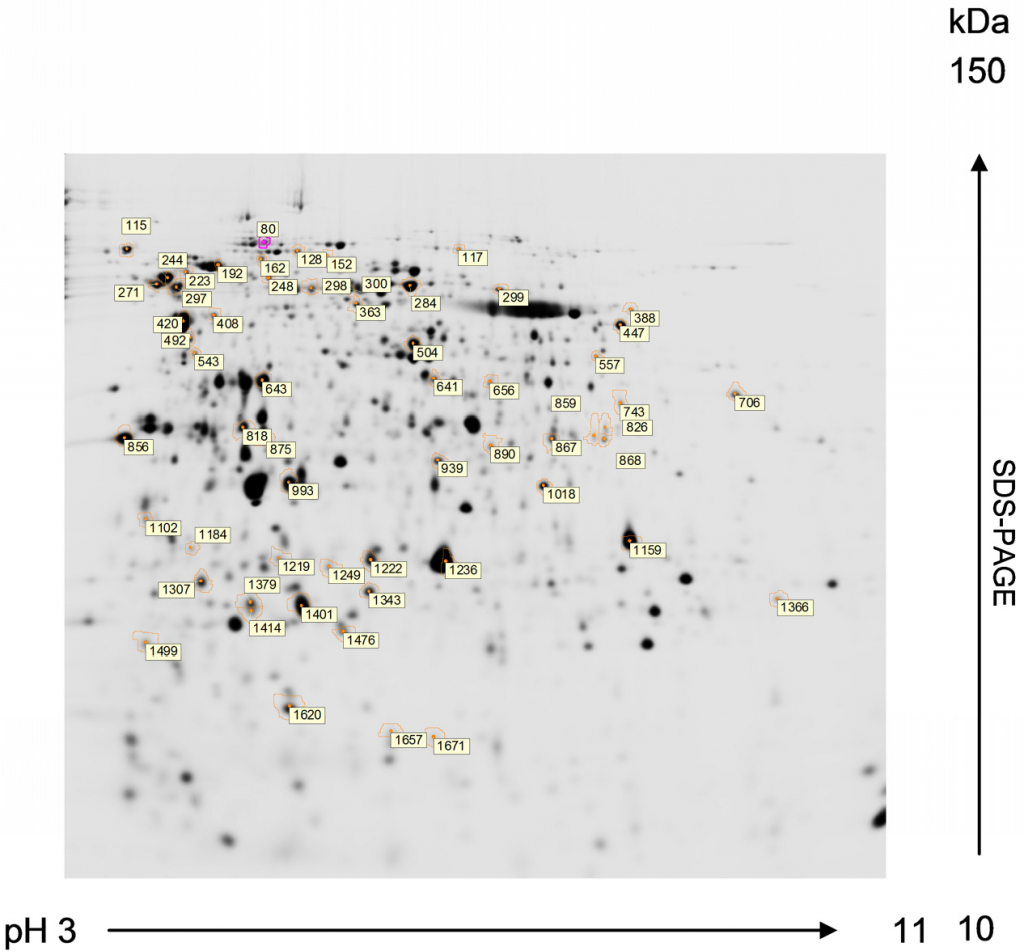
Two-dimensional gel electrophoresis (2-DE) is based on separating a mixture of proteins according to two molecular properties, one in each dimension. The most used is based on a first dimension separation by isoelectric focusing and second dimension according to molecular weight by SDS-PAGE (Figure 3.15).
The general workflow in a 2-DE experiment would be:
- Sample Preparation
The method of sample preparation depends on the aim of the research and is crucial to the success of the experiment. Factors such as the solubility, size, charge, and isoelectric point (pI) of the proteins of interest enter into sample preparation. Sample preparation is also important in reducing the complexity of a protein mixture. The protein fraction to be loaded on a 2-DE gel must be in a low ionic strength denaturing buffer that maintains the native charges of proteins and keeps them soluble.
- First-Dimension Separation
This part is performed by IEF. Using this technique, proteins are separated on the basis of their pI, the pH at which a protein carries no net charge and will not migrate in an electrical field.
- Equilibration
A conditioning step is applied to proteins separated by IEF prior to the second-dimension run. This process reduces disulfide bonds and alkylates the resultant sulfhydryl groups of the cysteine residues. Concurrently, proteins are coated with SDS for separation on the basis of molecular weight.
- Second-Dimension Separation
This part is performed by SDS-PAGE. The choice for the gel depends on the protein molecular weight range to be separated. The ability to run many gels at the same time and under the same conditions is important for the purpose of gel-to-gel comparison.
- Staining
In order to visualize proteins in gels, they must be stained in some manner. The selection of staining method is determined by several factors, including desired sensitivity, linear range, ease of use, expense, and the type of imaging equipment available. At present there is no ideal universal stain. Sometimes proteins are detected after transference to a membrane support by western blotting, which is described in more detail below.
- Image Analysis
The ability to collect data in digital form is one of the major factors that enable 2-DE gels to be a practical means of collecting proteome information. It allows unprejudiced comparison of gels and cataloging of immense amounts of data. Many types of imaging devices interface with software designed specifically to collect, interpret, and compare proteomics data. One of the biggest problems in 2-DE is the analysis and comparison of complex mixtures of proteins. Currently there are databases capable of comparing two-dimensional gel patterns. These systems allow automatic comparison of spots for the precise identification of those needed in the quantitative analysis.
- Protein Identification
Once interesting proteins are selected by differential analysis or other criteria, the proteins can be excised from gels, distained and digested to prepare their identification by mass spectrometry. This technique is known as peptide mass fingerprinting. The ability to precisely determine molecular weight by matrix-assisted laser desorption/ionization- time of flight mass spectrometry (MALDI-TOF MS) and to search databases for peptide mass matches has made high-throughput protein identification possible. Proteins not identified by MALDI- TOF can be identified by sequence tagging or de novo sequencing using the Q-TOF electrospray LC-MS-MS.
Fig. 3.15 Two-Dimentional Gel Electrophoresis. Proteins of Chlamydomonas reinhardtii resolved by 2-DE from preparative gels stained with MALDI-MS compatible silver reagent for peptide mass fingerprinting analysis. First dimension: isoelectric focusing in a 3-11 pH gradient. Second dimension: SDS-PAGE in a 12% acrylamide (2.6% crosslinking) gel (1.0 mm thick). Numbered spots marked with circle correspond to proteins compared to be subsequently identified by MALDI-TOF MS. The MALDI-TOF MS analysis of protein sequences is discussed in more detail in section 3.3 below.
Image from Magdeldin, S.
back to the top
Antibody Structure and Production
(work derived from Charles Molnar and Jane Gair)
An antibody, also known as an immunoglobulin (Ig), is a protein that is produced by plasma cells after stimulation by an antigen. Antibodies are the functional basis of humoral immunity. Antibodies occur in the blood, in gastric and mucus secretions, and in breast milk. Antibodies in these bodily fluids can bind pathogens and mark them for destruction by phagocytes before they can infect cells. The molecule that is bound by an antibody is termed the antigen. Antibodies are highly specific for a single antigen or a group of antigens that share highly conserved structural features. Proteins can act as antigens that are recognized by antibodies. Thus, within the field of biochemistry and molecular biology, antibodies are used as important tools that help us to determine the function and expression pattern of proteins. They can also be used therapeutically in the treatment of diseases such as cancer.
Antibody Structure
The most common type of antibody used in biochemical methodologies is known as immunoglobulin G (IgG) and will be the focus of this section. An IgG antibody molecule is comprised of four polypeptides: two identical heavy chains (large peptide units) that are partially bound to each other in a “Y” formation, which are flanked by two identical light chains (small peptide units), as illustrated in Figure 3.16. Bonds between the cysteine amino acids in the antibody molecule attach the polypeptides to each other. The areas where the antigen is recognized on the antibody are variable domains and the antibody base is composed of constant domains.
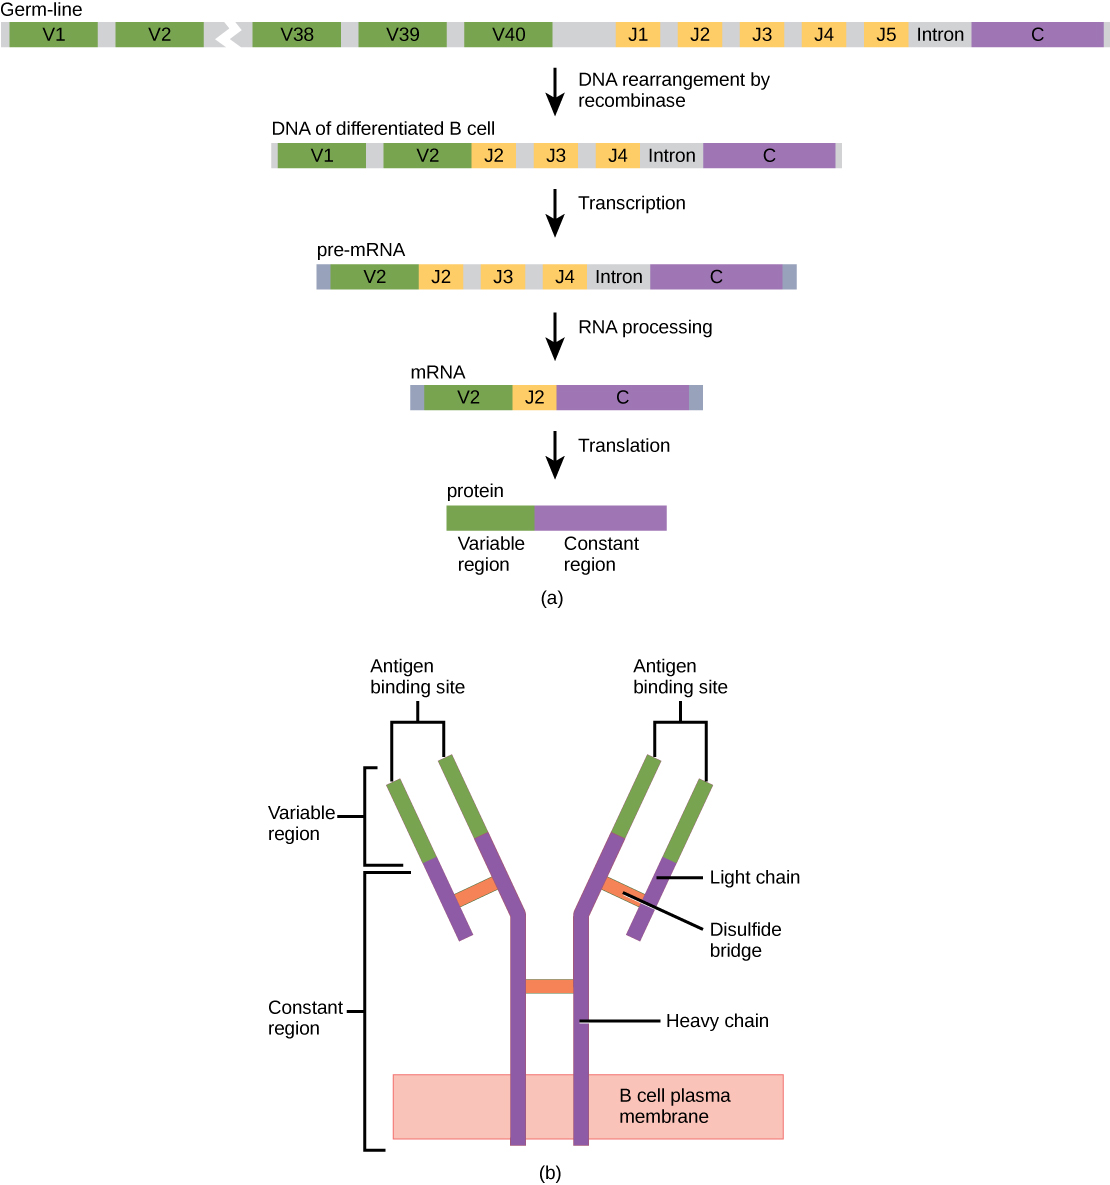
Figure 3.16 Immunoglobulin G (IgG) Structure (a) As a germ-line B cell matures, an enzyme called DNA recombinase randomly excises V and J segments from the light chain gene. Splicing at the mRNA level results in further gene rearrangement. As a result, (b) each mature B cell produces a single antibody that has a unique variable region capable of binding a different antigen.
Image from: Charles Molnar and Jane Gair
In germ-line B cells, the variable region of the light chain gene has 40 variable (V) and five joining (J) segments. An enzyme called DNA recombinase randomly excises most of these segments out of the gene during B cell maturation, and splices one V segment to one J segment. During RNA processing, all but one V and J segment are spliced out. Recombination and splicing may result in over 106 possible VJ combinations! As a result, each differentiated B cell in the human body typically has a unique variable chain that will recognize a unique antigen. The constant domain, which does not bind antibody, is the same for all antibodies.
Production of Polyclonal Antibodies
Antibodies used for research and diagnostic purposes are often obtained by injecting a lab animal such as a rabbit or a goat with a specific antigen. Within a few weeks, the animal’s immune system will produce high levels of antibodies specific for the antigen. These antibodies can be harvested in an antiserum, which is whole serum collected from an animal following exposure to an antigen. Because most antigens are complex structures with multiple epitopes, they result in the production of multiple antibodies in the lab animal. This so-called polyclonal antibody response is also typical of the response to infection by the human immune system. Antiserum drawn from an animal will thus contain antibodies from multiple clones of B cells, with each B cell responding to a specific epitope on the antigen (Figure 3.17).

Figure 3.17. Polyclonal Antibody Production. This diagram illustrates the process for harvesting polyclonal antibodies produced in response to an antigen.
Image from Polyclonal and Monoclonal Antibody Production
Lab animals are usually injected at least twice with antigen when being used to produce antiserum. The second injection will activate memory cells that make class IgG antibodies against the antigen. The memory cells also undergo affinity maturation, resulting in a pool of antibodies with higher average affinity. Affinity maturation occurs because of mutations in the immunoglobulin gene variable regions, resulting in B cells with slightly altered antigen-binding sites. On re-exposure to the antigen, those B cells capable of producing antibody with higher affinity antigen-binding sites will be stimulated to proliferate and produce more antibody than their lower-affinity peers. An adjuvant, which is a chemical that provokes a generalized activation of the immune system that stimulates greater antibody production, is often mixed with the antigen prior to injection.
Antiserum obtained from animals will not only contain antibodies against the antigen artificially introduced in the laboratory, but it will also contain antibodies to any other antigens to which the animal has been exposed during its lifetime. For this reason, antisera must first be “purified” to remove other antibodies before using the antibodies for research or diagnostic assays.
Production of Monoclonal Antibodies
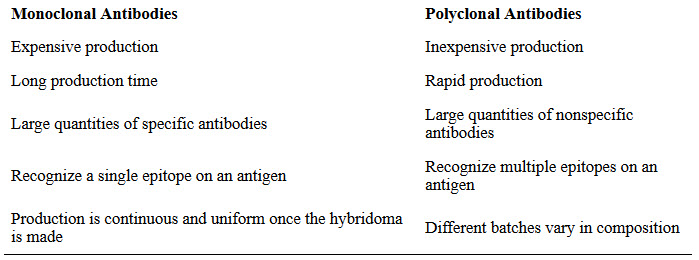
Some types of assays require better antibody specificity and affinity than can be obtained using a polyclonal antiserum. To attain this high specificity, all of the antibodies must bind with high affinity to a single epitope. This high specificity can be provided by monoclonal antibodies (mAbs). Table 3.4 compares some of the important characteristics of monoclonal and polyclonal antibodies.
Table 3.4 Comparison of Monoclonal and Polyclonal Antibodies
Unlike polyclonal antibodies, which are produced in live animals, monoclonal antibodies are produced in vitro using tissue-culture techniques. mAbs are produced by immunizing an animal, often a mouse, multiple times with a specific antigen. B cells from the spleen of the immunized animal are then removed. Since normal B cells are unable to proliferate forever, they are fused with immortal, cancerous B cells called myeloma cells, to yield hybridoma cells. All of the cells are then placed in a selective medium that allows only the hybridomas to grow; unfused myeloma cells cannot grow, and any unfused B cells die off. The hybridomas, which are capable of growing continuously in culture while producing antibodies, are then screened for the desired mAb. Those producing the desired mAb are grown in tissue culture; the culture medium is harvested periodically and mAbs are purified from the medium. This is a very expensive and time-consuming process. It may take weeks of culturing and many liters of media to provide enough mAbs for an experiment or to treat a single patient. mAbs are expensive (Figure 3.18).

Figure 3.18. Monoclonal Antibodies (mAbs) are produced by introducing an antigen to a mouse and then fusing polyclonal B cells from the mouse’s spleen to myeloma cells. The resulting hybridoma cells are cultured and continue to produce antibodies to the antigen. Hybridomas producing the desired mAb are then grown in large numbers on a selective medium that is periodically harvested to obtain the desired mAbs.
Image from Polyclonal and Monoclonal Antibody Production
back to the top
Enzyme-Linked Immunosorbent Assay (ELISA) and Microarrays
(work derived from the Human Atlas Project)
Since the very first use of antibodies for the detection of antigens, many different technologies have been developed that make use of the antibodies’ capability to bind to other molecules. During the 1950s, the scientists Yalow and Berson developed a method where radioactivity is used to determine the amount of an analyte in a solution. This so called ‘radioimmunoassay’ (RIA), for which Yarlow received the Nobel prize in 1977, was a very sensitive method for the detection of hormones but using radioactivity for antigen detection is not safe and suitable for a general use. Hence, an alternative procedure was developed by linking enzymes to antibodies instead of a radioactive molecule, and by adhering molecules to surfaces. In one of the nowadays most common applications today are measuring the quantity of a biomolecule in a sample by “enzyme-linked immunosorbent assay” (ELISA). This term originally refers to the use of an enzyme to report an interaction between an antibody and its binding partner (Gan & Patel, 2013). The foundation for Perlmann and Engvall in Sweden (Engvall & Perlmann, 1971) as well as Schuurs and van Weemen from the Netherlands (Van Weemen & Schuurs, 1971), who built assays with immobilized and enzyme-modified reagents in the early 1970s. Today, scientists also use colored molecules (so called fluorophores) that re-emit light upon excitation to visualize antibody-antigen interactions. Many variants of experimental procedures have been developed, and it is common to build assays using more than one antibody to detect a target of interest (see Figure 3.xx C-D). To further enhance the possibilities offered by the immunoassay format, applications based on microarrays have been developed and which allow to measure more than one molecule in a single reaction chamber (see below).
ELISA Assay Design
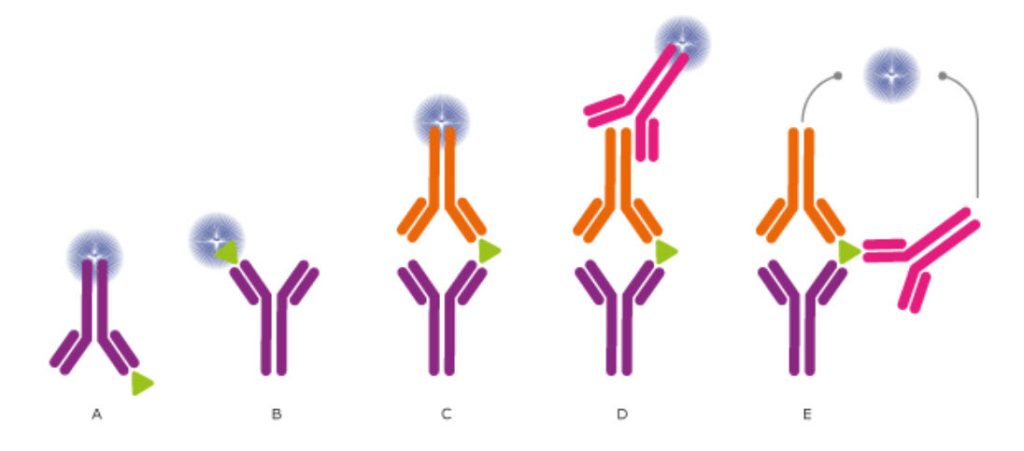
The use of antibodies allows designing experiments in many different ways for the intended analysis. To achieve the best possible results from the experiment, different reagents, additives, and solutions have to be tested for their optimal combination and concentration, incubation times and the number of wash cycles need to be evaluated and adjusted. This is to avoid unwanted interactions, which disturb the analysis from detecting the target of interest. Moreover, the mode of how a target is identified and detection can be performed in a number of ways, as described in Figure 3.19
Figure 3.19. Different setups for ELISA and Other Immunossays. In ELISA assays, the antibodies may (A) detect an immobilized antigen, (B) capture a labeled antigen, (C) capture an unlabeled antigen and use a second, labeled antibody to detect the captured antigen, or (D) use a third antibody for detection, or even use two antibodies for detection (E). Direct labeling of the antibody or antigen as in (A), (B), and (C) is the simplest and fastest method for detection. Using a secondary antibody as detection method, as shown in (D) and (E), will further increase the sensitivity and selectivity of the analysis. The method used in (D) also allows greater flexibility, whereas method (E) further increases the specificity, as three antibodies must bind the antigen in order to produce a reporter molecule. Out of the presented assays, the most commonly used concepts are shown in (C) and (D).
Image from The Human Atlas Project
Multiplexing
A new era in immunoassays started with the development of a technology called microarrays. The term microarray most commonly describes the ordered organization of small volume droplets that have dried on a small surface area. The reaction dimensions are miniaturized so that many assays can be performed in multiple samples in parallel, several thousands of different features may be presented to the surrounding solution. This means that scientists can measure a large number of molecules with one single experiment. There is the possibility to use microscope glass slides and specialized robotics that deposit very small drops of liquid (1 nl = 0.000000001 liter) on the glass surface in an ordered fashion. This leaves behind spots of less than one millimeter in diameter (0.15 mm). Another common technique for multiplexing is to use even smaller and color-coded particles (diameter of 0.005 mm). These particles can be coated with antibodies to fish out the analyte from the solution.
Sensitivity
In many applications it is important to measure very small amounts (sometimes only traces) of a molecule in a given sample. In order to achieve the required sensitivity, the conditions of the experiment need to be adjusted to suit the antibodies, the detection system, and the type of samples. In addition, there is progress being made on using better colors,signal amplification specialized lasers and filters, as well as miniaturization (Ekins & Edwards, 1997).
Specific examples
There are many examples of how ELISA assays may be used in basic research and in clinical diagnostics. One specific example is the sensitive sandwich-type enzyme-linked immunoassay used to determine the amount of the protein prostate-specific antigen (PSA), which is a biomarker used to detect prostate cancer (Kuriyama et al., 1980).
Microarray assays on the other hand, have previously received a lot of attention for their use in parallel analysis of DNA and RNA molecules. To translate their advantages to assays for the analysis of proteins with antibodies, new protocols and routines had to be developed and established. Nowadays, there are multiplexed techniques for measuring the amount of proteins in different sample types (e.g. cells, blood serum, urine), to determine how proteins are modified in biological processes (e.g. phosphorylation), or to describe specific protein-protein interactions. Another example is the analysis of antibodies circulating in blood from patients. Microarray-based applications have also been built for purified antibodies and to study the antibody binding characteristics – an important aspect when using binding reagents as research reagents. Such protein microarrays can either consist of proteins, protein fragments, or small peptides to test the specificity of the binding reagent. Protein microarrays can reveal the interactions to entire proteins or larger protein fragments, while peptide microarrays show to which particular parts (epitopes) of the proteins the antibodies bind. A typical epitope mapping result is shown in Figure 3.20 (Edfors et al., 2014). Synthesizing millions of overlapping peptides with only one amino acid residue shift on such arrays enables the mapping of antibody binding regions at high resolution. This gives very detailed information of the linear (continuous) epitopes recognized by an antibody. Just like with proteins, protein fragments or other antigens, the assembly of peptides on arrays may also be used for studies of antibody reactivity in plasma samples from patients with infectious and autoimmune diseases.
Figure 3.20. Epitope Mapping of Polyclonal Antibodies. Polyclonal antibodies binding to a peptide array where the result displays four distinct linear epitopes and the consecutive overlapping peptides which are bound. X-axis: peptides, Y-axis: mean fluorescence intensity (MFI). (Edfors et al., 2014)
Image from The Human Atlas Project
back to the top
Western Blot
(work derived from the Human Atlas Project)
Western Blot (WB) is a common method to detect and analyze proteins. It is built on a technique that involves transferring, also known as blotting, proteins separated by electrophoresis from the gel to a membrane where they can be visualized specifically. The procedure was first described by H. Towbin et al in 1979 (Towbin, Staehelin, & Gordon, 1979) and two years later given its name by W. Neal Burnette (Burnette, 1981). Towbin et al described electrophoretic transfer of proteins from polyacrylamide gels to nitrocellulose sheets where the original gel pattern was accurately obtained. The setup consists of a standard set of seven steps, Figure 3.21.
Figure 3.21. The Standard Steps in Western Blotting. The standard steps involve sample preparation (1), Gel electrophoresis (2), Blotting to membrane (3), Antibody probing (4), Detection (5), Imaging (6) and Analysis (7).
Image from the Human Atlas Project.
Samples are prepared and loaded on to a gel and during the electrophoresis the negatively charged proteins move toward the positively charged anode. In order to further analyze the proteins, they are transferred onto a membrane in a procedure called blotting. After the transfer, the membrane is blocked in order to prevent unwanted membrane-protein interaction in the following steps. To visualize the protein of interest the membrane is commonly first probed using a primary protein-specific antibody followed by a labeled secondary antibody used for detection. An image is taken of the membrane and the result is analyzed.
By adding a separate marker solution to one of the wells in the gel, it is possible to estimate the size of the protein in addition to the antibody interactions that are used to verify the specific protein. The separation on the gel is not only due to size but also to some extent depending on the molecular charge, hydrophobic regions, and degree of denaturation. The setup of the experiment can be varied in many ways to best suit the specific inquiry. When analyzing the results, variations between lanes regarding loading and transfer rates between blots, must be taken into consideration. In addition, the non-linear relation of the generated signal across the concentration range of the samples is also an aspect of consideration when interpreting the results. The outcome of a WB experiment depends on three important factors; the ability of the antibody to bind a specific protein, the strength of the interaction, and the concentration of the protein of interest itself. Moreover, the specificity of the binding to the target and a low cross reactivity are important features as well. The result form the WB is not always easy to interpret as the size of the protein may vary from the theoretical weight due to posttranslational modifications, such as glycosylation, or interactions with other proteins. However, WB is a very common method and almost all available commercial antibodies have been validated using this method.
Sample preparation
The first step of a WB is to prepare the sample, e.g. tissue, cells, or other solution, which is going to be analyzed. Usually the tissue needs to be broken down by blending, homogenization, or sonication. Buffers are added to lyse the cells and solubilize the proteins and often an inhibitor is added to prevent denaturation or degradation. Different types of filtration and centrifugation methods are applied to further prepare the samples. It is important to determine the total protein concentration of the generated extract to be able to load a specific amount on the gel to enable comparison between samples. Usually a biochemical assay is used in order to determine the protein concentration. The extract is then diluted with loading buffer consisting of glycerol and a dye (e.g. bromophenol blue). The glycerol is used to simplify the loading by raising the density of the extract and the dye is added to visualize the sample. Heat is applied on the samples in order to break the structures of the protein, which will help keeping the negative charge from neutralization (Mahmood & Yang, 2012). Preferably positive and negative controls are included in the set up to confirm identity of the protein as well as the activity of the antibody.
Gel electrophoresis
After sample preparation the extract is ready to be loaded to separate the proteins according to size by gel electrophoresis. An electric field is applied over the gel that causes the charged molecules to move. In WB polyacrylamide gels are used for protein separation and the method is therefore called polyacrylamide gel electrophoresis (PAGE) when using native condition. For denaturing conditions, sodium dodecyl sulfate (SDS) is added to the system and the method is therefore called SDS-PAGE. The SDS binds to the protein and form a negatively charged micelle around the protein regardless of inherent charge. The denaturing condition dissolves the tridimensional structure of the proteins and the charge of the protein becomes relative to its size resulting in separation of the proteins only by size. When using native conditions the mobility is depending on both charge and hydrodynamic size allowing detection of changes in charge due to chemical degradation, conformational changes due to folding or unfolding, aggregation, or other binding events.
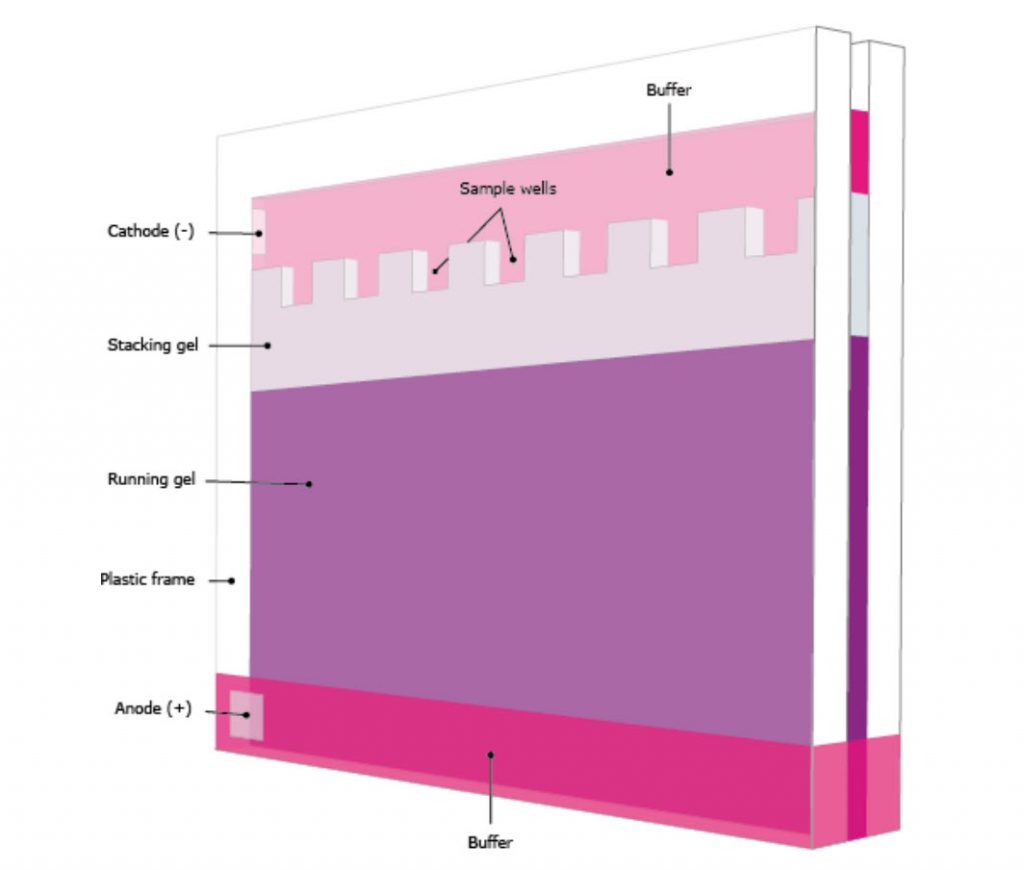
The gel typically consists of two sections with different densities: (i) a stacking gel, and (ii) a separating gel, (Figure 3.22). The differences between the two sections are in pH and gel concentration. With somewhat acidic pH and a lower concentration of acrylamide the stacking gel separates the proteins poorly but allows them to form highly defined sharp bands before they enter the separating gel. With more basic conditions and higher gel concentration, the separating gel makes the proteins differentiate by size as smaller proteins travel faster in the gel than bigger ones. Precast gels are convenient; however, it is possible to cast them by hand. The gel is immersed in buffer and the protein samples and markers are loaded to the wells in the gel. A voltage is applied on the gel and the proteins will start to travel down the gel due to their negative electrical charge. Selecting the proper voltage is important since too high voltage will overheat the gel and maybe deform the bands.
Figure 3.22. A Typical Vertical Polyacrylamide Gel in Buffer
Blotting to membrane
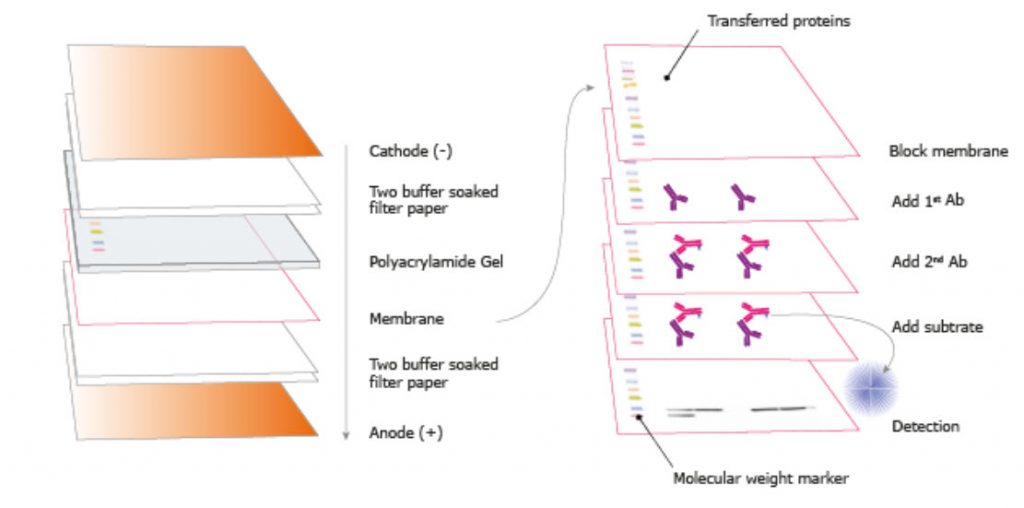
After gel electrophoresis the proteins are transferred to a solid support membrane, which is the third step of Western Blot. In the transfer process voltage is applied to transfer the proteins from the gel to the membrane. The setup includes sponges, filter papers, the gel, and the membrane, which is placed between the gel and the positive electrode (Figure 3.23). This ensures the migration of the negatively charge proteins from the gel to the membrane. There are three types of membranes: nitrocellulose, polyvinylidene difluoride (PVDF), and nylon. Even though nylon membranes are superior in several aspects, the high background binding and irreversible staining of some dyes makes this type of membrane less common than the other two alternatives. The major advantage of nitrocellulose membranes is the low background regardless of detection method. Due to a relatively large average pore size, nitrocellulose membranes should not be used for transfer of proteins with low molecular weight. Moreover, when dry, the membrane becomes brittle which makes them difficult to handle. The more stable PVDF membrane allows relabeling and is more convenient to store. The hydrophobic nature of PVDF result in high protein binding capacity, however, as a consequence the background is also higher.
Figure 3.23. Transfer Procedure for Western Blotting. The proteins in the gel are transferred to a membrane and the sample is visualized through blocking, adding antibodies, and washing according to a certain schedule.
Image from the Human Atlas Project.
There are two methods for the blotting called wet and semi-dry. The wet conditions are preferred when the transfer must be efficient and give high quality regarding distinct and sharp bands. In addition, this is the better choice for transfer of larger protein complex. The gel, membrane, and filter papers are completely immersed in buffer during the transfer and there is no risk of drying out the gel. Semi-dry blotting is more rapid and less volume of buffer is needed. However, this transfer method is usually less efficient, especially for larger proteins, and there is a risk of overheating and drying the gel when using extended transfer times.
Antibody probing
The forth step of the WB is antibody probing. In order to prevent unspecific binding of the antibodies to the membrane, rather than binding specific to the protein of interest, a substance is used to block out the residual sites on the membrane. Common substances used are dried non-fat milk, 5% Bovine Serum Albumin (BSA) diluted in Tris Buffered Saline Tween (TBST), normal goat serum, casein, or fish gelatin (Mahmood & Yang, 2012). Milk is easy to get hold of and inexpensive, however not suitable for all detection labels. Fish gelatin gives lower background but can mask some proteins as well as being a relatively expensive blocking buffer. BSA is inexpensive, whereas serum can contain immunoglobulins giving rise to cross-reactivity. Careful selection of the blocking agent is key since none of the blocking buffers are ideal for all different antigen-antibody interactions. The blocking procedure consists of incubating the membrane in the appropriate blocking buffer for an hour or longer. When using long incubation times, the blocking should be performed at +4°C to rule out the risk of staining artifacts or background. Blocking is a delicate balance between reducing the background without decreasing the signal from the protein of interest.
The blocked membrane is thereafter incubated with the primary antibody. The antibody is diluted to a suitable concentration in TBST, phosphate buffered saline (PBS), or wash buffer. It is preferred to incubate the antibody with BSA if the antibody is going to be re-used. After washing the membrane, the membrane is incubated with the secondary antibody that binds to the primary antibody. The secondary antibody is labeled with a reporter. When using a polyclonal antibody as secondary antibody, it may give rise to some background. In the case of background staining, the secondary antibody may be pre-blocked with non-immune serum from the host it was generated in. Optimization of the concentration of the secondary antibody is recommended due to quite extended variations between antibodies as well as detection system used.
Detection
In the fifth step of a WB, the protein-antibody-antibody complex is detected on the membrane. There are several kinds of labeling of the secondary antibody, e.g. enzymes, fluorophores, biotinylation, gold-conjugation, and radioisotopes, as exemplified in Figure 3.24. Amongst enzymes the most common is HRP used together with chemiluminescent, chemifluorescent, or chromogenic substances. HRP has a high substrate specificity giving low background, is stable, and inexpensive. In chemiluminescense the HRP enzyme catalyzes the oxidation of luminol from the luminol peroxide detection reagent. The multi-step reaction generates light emission. Certain chemicals like phenols can enhance the emitted light. A direct method is the use of fluorescence; the fluorophores emit light after being excited and no detection agent is needed. It is well suitable for quantitative Western and since different fluorophores emit light of different wavelengths it is possible to perform multiplexing and specific detection of more than one protein at the time. Using a chemical and/or an enzyme to induce the generation of an active fluorophore from a fluorogenic substrate is called chemifluorescence. To further enhance the signal intensity a two-step biotin streptavidin based system may be used. Gold conjugation is also a method where proteins stain dark red due to accumulation of gold. It is also possible to use radioisotopes but they require special handling and are quite expensive.
Figure 3.24. Different Reporter Systems.
Image from the Human Atlas Project.
Imaging
Imaging is the sixth step of WB and the capturing can be analogue using a film, or digitally preformed with a CCD camera or scanner capturing the different kinds of emitted signals. The CCD imaging device enables quantitation with high detection sensitivity and a broad linear range with no chemical waste or need for a dark room. It may be used to detect membranes, stained gels, or for ultraviolet light applications.
Analysis
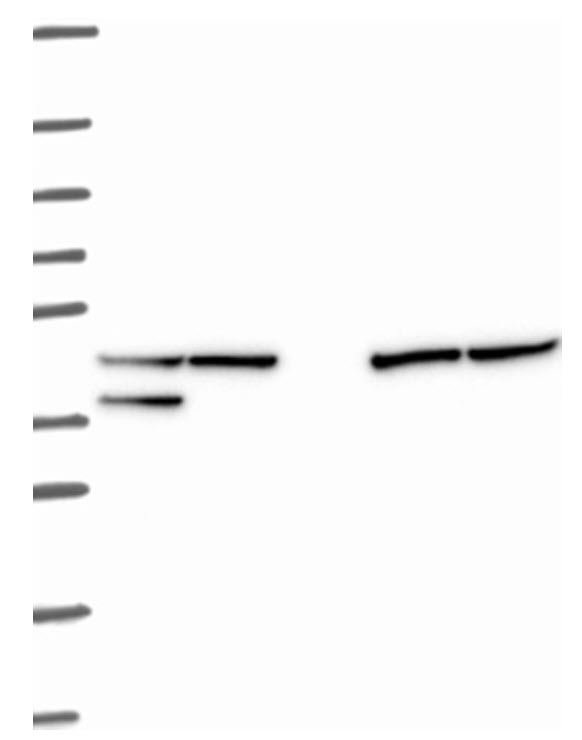
The last step of a WB is to analyze the results. In a typical qualitative application, the presence of a protein of interest is confirmed, the amount is approximated by visual inspection, and the size is determined by comparison with a marker. Improvements and developments, especially towards highly sensitive detection reagents and advanced imaging techniques, make WB a potential tool for quantitative analysis. The quantitative applications entail a definition of the amount of protein in relative or absolute terms. Some factors are to take under consideration like sensitivity, signal stability, linear dynamic range, normalization, and the signal-to-noise ratio. The minimum of protein that can be seen in a given assay gives the limits of detection (LOD), and the limit of signal intensity that can be reliably used for precise quantification is the limit of quantification (LOQ). Factors that affect these terms are antibody quality and concentrations as well as exposure times when considering the minimum amount of protein detected. A stable signal system expands the time window for reaching high sensitivity, multiple exposures, and possibility to detect weak bands. The range that allows an even and precise quantitation where the signal intensity still is proportional to the amount of protein is called the linear dynamic range. It is important to avoid signal saturation due to excessive amounts of protein or high concentrations of antibodies. A low LOD and quantitation of both weak and strong signals gives a broad linear dynamic range. The protein of interest should be normalized to an internal reference that allows fluctuations in amount of protein loaded onto each well or different concentrations. This can be achieved with housekeeping or spiked protein. The ratio between the signal and noise is important in order to properly quantitate the protein. This is of outmost importance when detecting weak bands where a higher background is expected. A typical Western Blot is seen in Figure 3.25.
Figure 3.25. Typical Western Blot result using HRP-conjugated antibodies and a CCD camera.
Image from the Human Atlas Project.
back to the top
Immunohistochemistry
(work derived from the Human Atlas Project)
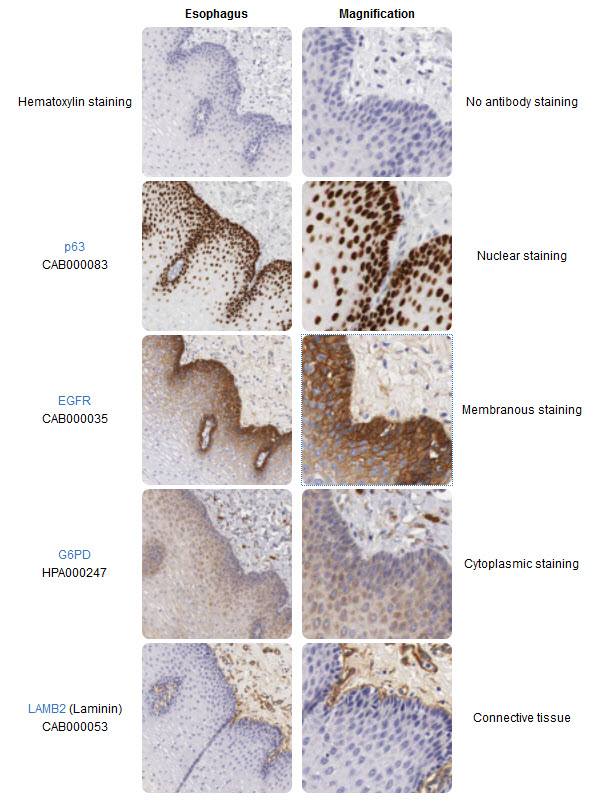
Immunohistochemistry (IHC) is a powerful microscopy-based technique for visualizing cellular components, for instance proteins or other macromolecules in tissue samples. The strength of IHC is the intuitive visual output that reveals the existence and localization of the target-protein in the context of different cell types, biological states, and/or subcellular localization within complex tissues.
The IHC technique was invented during the 1940s (Coons, Creech, & Jones, 1941) and is routinely used as an important tool in health care and pathology for e.g. diagnostic purposes or to stratify patients for optimized treatment regimes. IHC is also widely used in research where molecules of interest are analyzed to study their roles in both healthy and diseased cells and tissues on the molecular, cellular or tissue level. There are many different ways to perform visualization of targets in tissues using IHC or IHC-based methods, and numerous protocols exist for different applications and assays. Even though IHC is generally a robust and established method, new assays often need careful optimization depending on the tissue or on the properties of the target protein, binder-molecule and/or reporter system. Many years of technical development and the hugely increased availability for specific binding-molecules have greatly improved the usefulness and areas of applications for IHC. The progress in the field of IHC-based techniques and reagents has enabled scientists and health care providers with more precise tools, assays and biomarkers. In addition, technical advances have enabled e.g. highly sensitive simultaneous detection of multiple proteins in the same sample, and the detection of protein-protein interactions.
The classical IHC assay is illustrated in Figure 3.26 and involves detection of epitopes expressed by a single protein-target within a tissue sample using a “primary antibody” capable of binding those epitopes with high specificity. After the epitope-antibody binding event, a “secondary antibody” capable of binding the primary antibody with high specificity is added. The secondary antibody is coupled to a reporter molecule and after the antibody-antibody binding event, a chemical substrate is added which reacts with the reporter molecule to produce a colored precipitate at the site of the whole epitope-antibody complex.
Figure 3.26. The Basic Principle of Immunohistochemistry. In the schematic illustration, a formalin-fixed paraffin embedded tissue section is stained using a primary antibody directed towards a specific protein target. A solution containing the primary antibody is added to the tissue section and the antibodies are allowed some time to find and bind to their target. After this step, unbound and surplus antibodies are washed away and the secondary antibody is added. The secondary antibody, which carries a linker molecule with horseradish peroxidase (HRP) enzymes, is also allowed some time to bind to the primary antibody, followed by another washing step. After this, 3,3′ Diaminobenzidine (DAB) is added. The HRP enzyme transforms the DAB substrate into a brownish precipitate that is deposited in the tissue at the site of the reaction, thus producing a visual representation of where the primary antibody first bound its target.
Image from The Human Atlas Project
Tissue preparation
The tissue plays a central role in the experiment and it is important that it is processed so that epitopes and proper morphology is preserved. The most common processing for IHC is to prepare formalin-fixed paraffin-embedded (FFPE) tissue blocks. The purpose of formalin fixation is to produce chemical cross-linking of proteins within the tissue. This terminates all cellular processes and freezes the cellular components at the place and in the conformation they were in at the time of fixation and also prevent degradation. After adequate fixation, the tissue is further processed and ultimately embedded in paraffin blocks, which are then sectioned into thin slices (usually 4-10µm) using a microtome. The sections are transferred to glass slides and allowed to adhere prior to further processing.
Other methods for fixation besides formalin are sometimes used. These include other types of aldehydes or using different alcohol solutions. The best choice of fixative is very much dependent on the assay. A common alternative to FFPE is to prepare frozen tissue samples. In this case, the tissue is embedded in a cryoprotective medium and frozen, and fixation is performed post-sectioning. Frozen tissues are sectioned in cryostats and have the advantage of short processing times and of better preservation of sensitive epitopes, but can often be inferior to FFPE tissues in terms of preserving histological morphology.
Antigen (epitope) retrieval
A concern associated with cross-linking fixatives like formalin, or too long time spent in fixative medium is the masking of epitopes, which can obstruct the primary antibody from binding to its target. Especially with FFPE samples, there is often a need to revert some of the chemical crosslinking and “retrieve” the epitopes before proceeding to the actual IHC. There are several antigen retrieval protocols available and the main strategies include treating the tissue slide with heat, digestive enzymes, detergents, or combinations thereof. The most common method for antigen retrieval in FFPE samples is to pressure-boil the tissue slides in an acidic citrate buffer for around 15-20 minutes.
Antibody binding
The quality and specificity of the binding molecule is crucial for any IHC based technique, and the choice of binder can directly affect the outcome, reliability, and possibly also the interpretation of the assay. Antibodies are by far the most common type of binding-molecule used for IHC, and although most antibodies are able to adequately detect the correct molecule of interest, they may also vary greatly in their specificity for their intended target. Antibodies with high specificity are therefore more reliable when interpreting “on-target” binding, since they produce little or no “off-target” binding or “background”. Antibodies that are less specific can produce more off-target binding, and the resulting background will possibly interfere with the correct interpretation of the true on-target signals. There are two main types of antibodies; polyclonal antibodies which is a heterogeneous mix of antibodies that bind different epitopes on the target and monoclonal antibodies that all bind the same epitope. Polyclonal antibodies are often very potent due to their ability to detect and bind multiple epitopes on the same target. However, the epitopes they bind are often poorly defined and with multiple and varying epitope-specificities comes the increased likelihood of off-target binding events and background noise. However, the potency of polyclonal antibodies can be advantageous since the concentration of binding events around the on-target molecule usually outweighs potential background noise. A drawback is that polyclonal antibodies are usually limited resources since they are derived from animal sera. Monoclonal antibodies, by contrast, have more continuity since they can be produced in hybridoma cell lines. Monoclonal antibodies are also often well defined in terms of epitope binding, but can still generate results that are hard to interpret if the specificity is low or if the target epitope is present in low abundance.
Careful optimization and titration of antibody concentration for each assay is needed, since the result is dependent not only on the antibody’s specificity and affinity for the target, but also on the concentration and availability of on-target and potential off-target epitopes present in the sample. Adding too much antibodies to the sample will increase the number of possible low-affinity off-target binding events once the on-target epitope(s) are saturated with binders. By lowering the antibody concentration, off-target binding events become rarer as they usually have lower affinity than on-target binding events. The risk when attempting to reduce background while using a low-affinity antibody is that the on-target signals are concomitantly weakened to the point of providing a false negative result.
Other types of binder molecules sometimes used in IHC-based techniques include affibodies, peptides, antibody fragments or other small molecules.
Detection systems
The whole purpose of performing IHC is to obtain a visual representation of where the target can be found within the experimental tissue, and preferably also gain information about the target’s expression pattern among heterogeneous cell populations and/or subcellular localizations. This is exemplified in Figure 3.27, which illustrates how different antibodies are used to visualize different cellular or tissue compartments within a complex tissue. To visualize the target-antibody interaction, some kind of detection system that produces an observable stain or signal is needed. The most common method for introducing a detection system to the experiment is to use a secondary antibody that carries a pre-bound reporter molecule, i.e. enzyme or fluorophore. Secondary antibodies are usually targeted specifically towards antibody molecules from a different animal species. For example, if the primary antibody is raised in a rabbit, then the secondary antibody must be raised in another animal and targeted specifically towards rabbit antibodies.
Figure 3.27. Visualizing different protein targets in complex tissues. The right column shows a magnification of the corresponding images in the left column. In the IHC image, consecutive sections of human esophagus stained using four different antibodies allows for direct comparison of different protein expression patterns within the tissue and within subcellular compartments. The top images are only counterstained for hematoxylin for comparison. The p63 antibody stains cell nuclei in a population of cells that reside in the basal part of the esophageal epithelium. The EGFR (Epidermal growth factor receptor) antibody appears to stain the same cell population as p63, but stains cellular membranes instead of nuclei. The G6PD (Glucose-6-phosphate dehydrogenase) antibody stains the cytoplasm of a wider repertoire of esophageal epithelial cells and also cells residing in the connective tissue. The Laminin (LAMB2) antibody stains only cells and structures in the connective tissue underlying the esophagus.
Image from The Human Atlas Project
For FFPE tissue samples the most common detection method is to use enzymatic reactions to generate a colored precipitate at the site of antibody binding. The secondary antibodies then carry an enzyme, e.g. horseradish peroxidase (HRP) or alkaline phosphatase (AP), that are capable of converting chromogens like 3,3′ Diaminobenzidine (DAB) or 5-bromo-4-chloro-3-indolyl phosphate/ p-nitroblue tetrazolium chloride (BCIP/NBT) into brown or bluish precipitates that are deposited in the tissue at the site of the reaction. Chromogenic stains are observable in light-microscopy and are usually very stable over long periods of time, which is beneficial if the experiment needs to be archived or reviewed at a later time point.
For frozen tissue sections it is more common to use fluorophore-linked secondary antibodies that emit a specific color (usually green, red, or blue) when excited by the correct wavelengths of light. Moreover, fluorophores are usually not stable for long periods of time. However, the benefit of using fluorophores is that they provide an easy method for performing double-labeling experiments where several antibodies towards multiple targets are assayed in the same sample. The secondary antibodies need to be targeted towards different primary antibodies and also to be coupled to different fluorophores. The different secondary antibodies are then observed separately by exciting them sequentially with different wavelengths of light. These different excitation results are saved as separate images (or color channels) and may later be overlaid to infer protein co-localizations etc.
Using reporter-carrying secondary antibodies for detection is in itself an amplification step since several secondary antibodies are able to bind a single primary antibody, but sometimes further amplification steps are desired to increase the signal and sensitivity of the experiment. In such cases, the secondary antibody may instead carry “linker molecules”, for instance biotin polymers, which are able to recruit a larger number of reporter molecules in subsequent steps. This strategy for amplifying signals is useful for both enzymatic and fluorescent detection methods.
Counterstaining
Immunohistochemical staining using chromogens often benefits from having a counterstain applied that enhances the contrast and facilitates the observation of histological features. The most common type of counterstain used for FFPE samples is hematoxylin that stains cellular cytoplasm with a pale bluish color, and stain cell nuclei in a darker bluish nuance, as shown in Figure 3.26. Fluorescent stainings are usually not counterstained with hematoxylin, since the detection method is not based on light microscopy. Instead, the most common way to obtain counterstaining for fluorescence is to label cell nuclei by adding fluorescent dyes that bind nucleic acids, as shown in Figure 3.28. After the actual immunohistochemical reaction, the only remaining steps are to coverslip and seal the sample for protection and longterm storage. The most common way is to “glue” the coverslip to the sample using commercially available purpose-made resins.
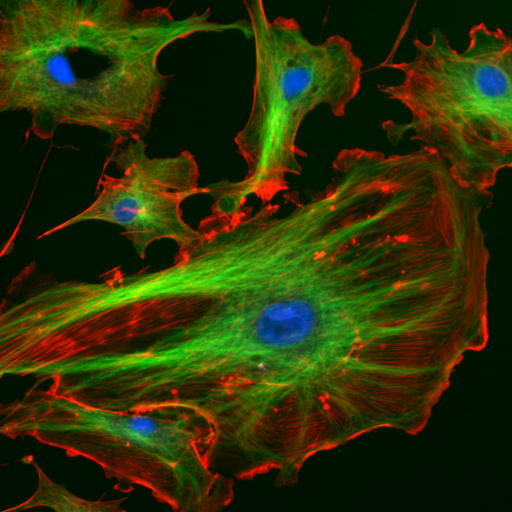
Figure 3.28 Endothelial cells under the microscope. Nuclei are stained blue with DAPI, microtubles are marked green by an antibody bound to FITC and actin filaments are labelled red with phalloidin bound to TRITC. Bovine pulmonary artery endothelial cells
Image from NIH ImageJ-Programmpaket
Specific examples
IHC is widely used in both research and clinical practice. The Human Protein Atlas (HPA) project is a prime example of how high-throughput IHC is used to achieve large-scale mapping of the human proteome in a multitude of tissues, cancers and cells. In the HPA project, a streamlined in-house large scale antibody production chain facilitates the generation of specific antibodies, which after passing basic characterization and validation regimes, are used to systematically stain tissue microarrays containing hundreds of tissue cores within a single experiment. The system for IHC employed by HPA relies heavily on standardization of protocols and automatisation using machines, but the evaluation of the optimal titration for each antibody is performed manually before the antibody is approved for staining on the full set of tissues. Each stained tissue core is annotated with respect to immunohistochemical staining in tissues and cell types, and thereafter published as a high resolution image on the web portal to be freely viewed by anyone.
In clinical practice, IHC is mainly used within pathology to aid physicians to evaluate tissue specimens with respect to healthy and or diseased states, to set diagnoses, and to define the molecular subtype of different types of cancer. A specific example where IHC is used diagnostically is when pathologists are presented with a metastatic tumor sample and the tissue origin of the primary tumor is unknown. In these cases, pathologists use a panel of different antibodies that target tissue specific proteins, such as prostate-specific antigen for prostate cancer, or estrogen receptor for gynecological cancers, or cytokeratin 20 for gastrointestinal cancers (Gremel et al., 2014). Once a broad classification is made, additional tissue specific antibodies are used to further pinpoint the origin of the primary tumor. This information is useful for choosing the best or most appropriate strategy for drug therapy and/or to locate the primary tumor for radiation therapy and/or surgery.
back to the top
3.3 Protein Synthesis and Sequencing
Solid-Phase Protein Synthesis
Peptides are chemically synthesized by the condensation reaction of the carboxyl group of one amino acid to the amino group of another. Protecting group strategies are usually necessary to prevent undesirable side reactions with the various amino acid side chains. Chemical peptide synthesis most commonly starts at the carboxyl end of the peptide (C-terminus), and proceeds toward the amino-terminus (N-terminus). Protein biosynthesis (long peptides) in living organisms occurs in the opposite direction. Chemical synthesis facilitates the production of peptides which are difficult to express in bacteria, the incorporation of unnatural amino acids, peptide/protein backbone modification, and the synthesis of D-proteins, which consist of D-amino acids.
The established method for the production of synthetic peptides in the lab is known as solid-phase peptide synthesis (SPPS). Pioneered by Robert Bruce Merrifield, SPPS allows the rapid assembly of a peptide chain through successive reactions of amino acid derivatives on an insoluble porous support.
The solid support consists of small, polymeric resin beads functionalized with reactive groups (such as amine or hydroxyl groups) that link to the nascent peptide chain. Since the peptide remains covalently attached to the support throughout the synthesis, excess reagents and side products can be removed by washing and filtration. This approach circumvents the comparatively time-consuming isolation of the product peptide from solution after each reaction step, which would be required when using conventional solution-phase synthesis.
Each amino acid to be coupled to the peptide chain N-terminus must be protected on its N-terminus and side chain using appropriate protecting groups such as Boc (acid-labile) or Fmoc (base-labile), depending on the side chain and the protection strategy used (FIg. 3.29).
The general SPPS procedure is one of repeated cycles of alternate N-terminal deprotection and coupling reactions. The resin can be washed between each steps. First an amino acid is coupled to the resin. Subsequently, the amine is deprotected, and then coupled with the free acid of the second amino acid. This cycle repeats until the desired sequence has been synthesized. SPPS cycles may also include capping steps which block the ends of unreacted amino acids from reacting. At the end of the synthesis, the crude peptide is cleaved from the solid support while simultaneously removing all protecting groups using a reagent strong acids like trifluoroacetic acid or a nucleophile. The crude peptide can be precipitated from a non-polar solvent like diethyl ether in order to remove organic soluble by products. The crude peptide can be purified using reversed-phase HPLC. The purification process, especially of longer peptides can be challenging, because small amounts of several byproducts, which are very similar to the product, have to be removed. For this reason so-called continuous chromatography processes such as MCSGP are increasingly being used in commercial settings to maximize the yield without sacrificing on purity levels.
SPPS is limited by reaction yields, and typically peptides and proteins in the range of 70 amino acids are pushing the limits of synthetic accessibility. Synthetic difficulty also is sequence dependent; typically aggregation-prone sequences such as amyloids are difficult to make. Longer lengths can be accessed by using ligation approaches such as native chemical ligation, where two shorter fully deprotected synthetic peptides can be joined together in solution.
Figure 3.29 Solid-phase synthesis of a dipeptide using an (amine-functionalized) amide resin. The N-terminal protecting group (PG) can be Fmoc or Boc, depending on the protecting group scheme used. The amino acid side chains (R1, R2 etc.) are orthogonally protected.
Image by Bédard, F. and Biron, E. (2018) Frontiers in Microbiology 9:1048
Protein Sequencing using Edman Degradation
Edman degradation, developed by Pehr Edman, is a method of sequencing amino acids in a peptide (Fig. 3.30). In this method, the amino-terminal residue is labeled and cleaved from the peptide without disrupting the peptide bonds between other amino acid residues.
Figure 3.30 Edman Degradation Scheme. In this method, Phenyl isothiocyanate is reacted with an uncharged N-terminal amino group, under mildly alkaline conditions, to form a cyclical phenylthiocarbamoyl derivative. Then, under acidic conditions, this derivative of the terminal amino acid is cleaved as a thiazolinone derivative. The thiazolinone amino acid is then selectively extracted into an organic solvent and treated with acid to form the more stable phenylthiohydantoin (PTH)- amino acid derivative that can be identified by using chromatography or electrophoresis. This procedure can then be repeated again to identify the next amino acid.
Image from Choij
A major drawback to Edman degradation is that the peptides being sequenced in this manner cannot have more than 50 to 60 residues (and in practice, under 30). The peptide length is limited due to the cyclical derivatization not always going to completion. The derivatization problem can be resolved by cleaving large peptides into smaller peptides before proceeding with the reaction. It is able to accurately sequence up to 30 amino acids with modern machines capable of over 99% efficiency per amino acid. An advantage of the Edman degradation is that it only uses 10 – 100 pico-moles of peptide for the sequencing process. The Edman degradation reaction was automated in 1967 by Edman and Beggs to speed up the process and 100 automated devices were in use worldwide by 1973.
Because the Edman degradation proceeds from the N-terminus of the protein, it will not work if the N-terminus has been chemically modified (e.g. by acetylation or formation of pyroglutamic acid). Sequencing will stop if a non-α-amino acid is encountered (e.g. isoaspartic acid), since the favored five-membered ring intermediate is unable to be formed. Edman degradation is generally not useful to determine the positions of disulfide bridges. It also requires peptide amounts of 1 picomole or above for discernible results.
Following 2D SDS PAGE the proteins can be transferred to a polyvinylidene difluoride (PVDF) blotting membrane for further analysis. Edman degradations can be performed directly from a PVDF membrane. N-terminal residue sequencing resulting in five to ten amino acid may be sufficient to identify a Protein of Interest (POI).
Sequence analysis by Matrix-Assisted Laser Desorption/Ionization-Time of Flight (MALDI-TOF) Mass Spectrometry.
Mass spectrometry is a technique to analyze with high accuracy the composition of different chemical elements and atomic isotopes splitting their atomic nuclei according to their mass- charge ratio (m/z). It can be used to identify different chemical elements that form a compound or to determine the isotopic content of different elements in the same compound.
Protein mass spectrometry refers to the application of mass spectrometry to the study of proteins. Mass spectrometry is an important method for the accurate mass determination and characterization of proteins, and a variety of methods and instrumentations have been developed for its many uses. Its applications include the identification of proteins and their post-translational modifications, the elucidation of protein complexes, their subunits and functional interactions, as well as the global measurement of proteins in proteomics. It can also be used to localize proteins to the various organelles, and determine the interactions between different proteins as well as with membrane lipids.
Two techniques are often used with liquid and solid biological samples: electro spray ionization and laser matrix- assisted laser desorption/ionization (MALDI). In the MALDI ionization analytes co- crystallized with a suitable matrix are converted into ions by the action of a laser. This source of ionization is usually associated with a time of flight analyzer (TOF) in which the ions are separated according to their mass-charge after being accelerated in an electric field. At last, a mass spectrometer detector records the charge induced or current produced when an ion passes by or hits a surface. A mass spectrum is recorded for each protein (Figure 3.31).
Figure 3.31. Protein identification by MALDI-TOF MS. Workflow of protein identification developing MALDI-TOF MS assay (A), followed by MS/MS fragmentation of peptides (B) and analysis of spectral data with the MASCOT database search algorithm (C).
Image from Magdeldin, S.
In general, proteins are analyzed either in a “top-down” approach in which proteins are analyzed intact, or a “bottom-up” approach in which protein are first digested into fragments. An intermediate “middle-down” approach in which larger peptide fragments are analyzed may also sometimes be used. The top-down approach however is mostly limited to low-throughput single-protein studies due to issues involved in handling whole proteins, their heterogeneity and the complexity of their analyses.
In the second approach, referred to as the “bottom-up” MS, proteins are enzymatically digested into smaller peptides using a protease such as trypsin. Trypsin is a serine protease from the PA clan superfamily, found in the digestive system of many vertebrates, where it hydrolyzes proteins. Trypsin cleaves peptide chains mainly at the carboxyl side of the amino acids lysine or arginine, except when either is followed by proline. It is used for numerous biotechnological processes. The process is commonly referred to as trypsin proteolysis or trypsinisation, and proteins that have been digested/treated with trypsin are said to have been trypsinized.
Subsequently, these peptides are introduced into the mass spectrometer and identified by peptide mass fingerprinting or tandem mass spectrometry. Hence, this approach uses identification at the peptide level to infer the existence of proteins pieced back together with de novo repeat detection. The smaller and more uniform fragments are easier to analyze than intact proteins and can be also determined with high accuracy, this “bottom-up” approach is therefore the preferred method of studies in proteomics. A further approach that is beginning to be useful is the intermediate “middle-down” approach in which proteolytic peptides larger than the typical tryptic peptides are analyzed.
Proteins of interest are usually part of a complex mixture of multiple proteins and molecules, which co-exist in the biological medium. This presents two significant problems. First, the two ionization techniques used for large molecules only work well when the mixture contains roughly equal amounts of constituents, while in biological samples, different proteins tend to be present in widely differing amounts. If such a mixture is ionized using electrospray or MALDI, the more abundant species have a tendency to “drown” or suppress signals from less abundant ones. Second, mass spectrum from a complex mixture is very difficult to interpret due to the overwhelming number of mixture components. This is exacerbated by the fact that enzymatic digestion of a protein gives rise to a large number of peptide products.
In light of these problems, the methods of one- and two-dimensional gel electrophoresis and high performance liquid chromatography are widely used for separation of proteins. The first method fractionates whole proteins via two-dimensional gel electrophoresis (Figure 3.32). The first-dimension of 2D gel is isoelectric focusing (IEF). In this dimension, the protein is separated by its isoelectric point (pI) and the second-dimension is SDS-polyacrylamide gel electrophoresis (SDS-PAGE). This dimension separates the protein according to its molecular weight. Once this step is completed in-gel digestion occurs.
In some situations, it may be necessary to combine both of these techniques. Gel spots identified on a 2D Gel are usually attributable to one protein. If the identity of the protein is desired, usually the method of in-gel digestion is applied, where the protein spot of interest is excised, and digested proteolytically. The peptide masses resulting from the digestion can be determined by mass spectrometry using peptide mass fingerprinting. If this information does not allow unequivocal identification of the protein, its peptides can be subject to tandem mass spectrometry for de novo sequencing. Small changes in mass and charge can be detected with 2D-PAGE. The disadvantages with this technique are its small dynamic range compared to other methods, some proteins are still difficult to separate due to their acidity, basicity, hydrophobicity, and size (too large or too small).
The second method, high performance liquid chromatography is used to fractionate peptides after enzymatic digestion. Characterization of protein mixtures using HPLC/MS is also called shotgun proteomics and MuDPIT (Multi-Dimensional Protein Identification Technology). A peptide mixture that results from digestion of a protein mixture is fractionated by one or two steps of liquid chromatography. The eluent from the chromatography stage can be either directly introduced to the mass spectrometer through electrospray ionization, or laid down on a series of small spots for later mass analysis using MALDI.

Figure 3.32 Schematic of Protein Fingerprinting by Mass Spectrometry. Protein mixtures are prepared from cell culture or tussie samples and separated by gel electrophoresis. Single proteins are isolated and digested using trypsin to produce a peptide mixture. Peptides are separated by liquid chromatography and analyzed by mass spectrometry
Image by Philippe Hupé
back to the top
3.4 Protein Structure Elucidation
X-Ray Crystallography
Protein X-Ray Crystallography is a technique used to obtain the three-dimensional structure of a particular protein by X-ray diffraction of its crystallized form. This three dimensional structure is crucial to determining a protein’s functionality. Making crystals creates a lattice in which this technique aligns millions of proteins molecules together to make the data collection more sensitive. It’s like getting a stack of papers, measuring the width with a ruler, and dividing that length with the number of pages to determine the width of one piece of paper. By this averaging technique, the noise level gets reduced and the signal to noise ratio increases. The specificity of the protein’s active sites and binding sites is completely dependent on the protein’s precise conformation. In addition to protein structure, other biological molecules can be investigated using X-ray crystallography. It was the X-ray crystallography by Rosalind E.Franklin, that made it possible for J.D. Watson and F.H.C. Crick to figure out the double-helix structure of DNA.
X-ray crystallography can reveal the detailed three-dimensional structures of thousands of proteins. The three components in an X-ray crystallographic analysis are a protein crystal, a source of X-rays, and a detector.
X-ray crystallography is used to investigate molecular structures through the growth of solid crystals of the molecules they study. Crystallographers aim high-powered X-rays at a tiny crystal containing trillions of identical molecules. The crystal scatters the X-rays onto an electronic detector. The electronic detector is the same type used to capture images in a digital camera. After each blast of X-rays, lasting from a few seconds to several hours, the researchers precisely rotate the crystal by entering its desired orientation into the computer that controls the X-ray apparatus. This enables the scientists to capture in three dimensions how the crystal scatters, or diffracts, X-rays. The intensity of each diffracted ray is fed into a computer, which uses a mathematical equation to calculate the position of every atom in the crystallized molecule. The result is a three-dimensional digital image of the molecule (Figure 3.33).
Crystallographers measure the distances between atoms in angstroms. The perfect “rulers” to measure angstrom distances are X-rays. The X-rays used by crystallographers are approximately 0.5 to 1.5 angstroms long, which are just the right size to measure the distance between atoms in a molecule. If the radiation had a wavelength much bigger or much smaller than the bond length of a covalent bond, the light would not diffract and no new knowledge of the structure would be obtained. That is why X-rays are used.

Figure 3.33 Workflow for Solving the Structure of a Molecule by X-ray Crystallography
Image from Thomas Splettstoesser
The process begins by crystallizing a protein of interest. Crystallization of protein causes all the protein atoms to be orientated in a fixed way with respect to one another while still maintaining their biologically active conformations – a requirement for X-ray diffraction. A protein must be precipitated out or extracted from a solution. The rule of thumb here is to get as pure a protein as possible to grow lots of crystals (this allows for the crystals to have charged properties, and surface charged distribution for better scattering results). 4 critical steps are taken to achieve protein crystallization, they are:
- Purify the protein. Determine the purity of the protein and if not pure (usually >99%), then must undergo further purification.
- Must precipitate protein. Usually done so by dissolving the protein in an appropriate solvent(water-buffer soln. w/ organic salt such as 2-methyl-2,4-pentanediol). If protein is insoluble in water-buffer or water-organic buffer then a detergent such as sodium lauryl sulfate must be added.
- The solution has to be brought to supersaturation(condensing the protein from the rest of the solvent forming condensation nuclei). This is done by adding a salt to the concentrated solution of the protein, reducing its solubility and allowing the protein to form a highly organized crystal (this process is referred to as salting out). Other methods include batch crystallization, liquid-liquid crystallization, vapor diffusion, and dialysis.
- Let the actual crystals grow. Since nuclei crystals are formed this will lead to obtaining actual crystal growth.
The crystals are then bombarded with X-rays, the diffraction patterns recorded, and the structure is reconfigured from the diffraction pattern using Fourier Transformation. Through the Fourier Transform, the electron density distribution is illustrated as a series of parallel shapes and lines stacked on top of each other (contour lines), like a terrain map. The mapping gives a three-dimensional representation of the electron densities observed through the x-ray crystallography. When interpreting the electron density map, resolution needs to be taken into account. A resolution of 5Å – 10Å can reveal the structure of polypeptide chains, 3Å – 4Å of groups of atoms, and 1Å – 1.5Å of individual atoms. The resolution is limited by the structure of the crystal and for proteins is about 2Å.
Many advances in drug discovery and medicine are due in large part by X-Ray Crystallography by identifying drug targets in many diseases that thrive today. In the late 80’s for example, scientists made a breakthrough in using X-Ray Crystallography to produce the structure of HIV Protease, an enzyme that was vital to the retrovirus’ life cycle. The enzyme cuts viral proteins strands that are main components of immature viral cells into separate, mature proteins that can continue on to form more mature and infectious viral particles. By looking closely at it structure, specifically its symmetry, researchers began making compounds that interacted with the active site of the enzyme, which is in the middle of its symmetric halves, to shut the enzyme down and prevent it from functioning properly. Amazingly, by the mid 90s, three HIV Protease inhibitor drugs were on the market, drastically reducing the death rate of the AIDS Virus (Figure 3.34)
Figure 3.34. Crystal structure of the D-enantiomer of backbone engineered HIV-1 PR prepared by totalchemical synthesis complexed to D-MVT101 inhibitor. (a) Cocrystals were obtained from50% ammonium sulfate, pH 5.4, in the space group P212121a = 67.5, b = 92.8, c = 29.4 Å.There were two monomers of protein and one inhibitor in the crystallographic asymmetricunit. (b) Stereo view of Cα tracing of D HIV-1 PR. Bound D MVT-101 inhibitor is shown asgreen sticks. Coordinates were deposited to HIV Structural Database;48 accession code:NCI2009
Image from: Miller, M. (2010) Biopolymers 94(4):521-529.
back to the top
Nuclear Magnetic Resonance (NMR) Imaging
Nuclear magnetic resonance spectroscopy of proteins (usually abbreviated protein NMR) is a field of structural biology in which NMR spectroscopy is used to obtain information about the structure and dynamics of proteins, and also nucleic acids, and their complexes. The field was pioneered by Richard R. Ernst and Kurt Wüthrich at the ETH, and by Ad Bax, Marius Clore, and Angela Gronenborn at the NIH, among others. Structure determination by NMR spectroscopy usually consists of several phases, each using a separate set of highly specialized techniques. The sample is prepared, measurements are made, interpretive approaches are applied, and a structure is calculated and validated.
NMR involves the quantum mechanical properties of the central core (“nucleus”) of the atom. These properties depend on the local molecular environment, and their measurement provides a map of how the atoms are linked chemically, how close they are in space, and how rapidly they move with respect to each other. These properties are fundamentally the same as those used in the more familiar magnetic resonance imaging (MRI), but the molecular applications use a somewhat different approach, appropriate to the change of scale from millimeters (of interest to radiologists) to nanometers (bonded atoms are typically a fraction of a nanometer apart). This change of scale requires much higher sensitivity of detection and stability for long term measurement. In contrast to MRI, structural biology studies do not directly generate an image, but rely on complex computer calculations to generate three-dimensional molecular models.
Currently most samples are examined in a solution in water, but methods are being developed to also work with solid samples. Data collection relies on placing the sample inside a powerful magnet, sending radio frequency signals through the sample, and measuring the absorption of those signals. Depending on the environment of atoms within the protein, the nuclei of individual atoms will absorb different frequencies of radio signals. Furthermore, the absorption signals of different nuclei may be perturbed by adjacent nuclei. This information can be used to determine the distance between nuclei. These distances in turn can be used to determine the overall structure of the protein.
A typical study might involve how two proteins interact with each other, possibly with a view to developing small molecules that can be used to probe the normal biology of the interaction (“chemical biology”) or to provide possible leads for pharmaceutical use (drug development). Frequently, the interacting pair of proteins may have been identified by studies of human genetics, indicating the interaction can be disrupted by unfavorable mutations, or they may play a key role in the normal biology of a “model” organism like the fruit fly, yeast, the worm C. elegans, or mice.
Protein nuclear magnetic resonance is performed on aqueous samples of highly purified protein. Usually, the sample consists of between 300 and 600 microlitres with a protein concentration in the range 0.1 – 3 millimolar. The source of the protein can be either natural or produced in a production system using recombinant DNA techniques through genetic engineering. Recombinantly expressed proteins are usually easier to produce in sufficient quantity, and this method makes isotopic labeling possible.
The purified protein is usually dissolved in a buffer solution and adjusted to the desired solvent conditions. The NMR sample is prepared in a thin-walled glass tube. (Figure 3.35)
Figure 3.35 The NMR Sample is Prepared in a Thin-Walled Glass Tube
Image from Kjaergaard
With unlabelled protein the usual procedure is to record a set of two dimensional homonuclear nuclear magnetic resonance experiments through correlation spectroscopy (COSY), of which several types include conventional correlation spectroscopy, total correlation spectroscopy (TOCSY) and nuclear Overhauser effect spectroscopy (NOESY). A two-dimensional nuclear magnetic resonance experiment produces a two-dimensional spectrum. The units of both axes are chemical shifts. The COSY and TOCSY transfer magnetization through the chemical bonds between adjacent protons (Figure 3.36). The conventional correlation spectroscopy experiment is only able to transfer magnetization between protons on adjacent atoms, whereas in the total correlation spectroscopy experiment the protons are able to relay the magnetization, so it is transferred among all the protons that are connected by adjacent atoms. Thus in a conventional correlation spectroscopy, an alpha proton transfers magnetization to the beta protons, the beta protons transfers to the alpha and gamma protons, if any are present, then the gamma proton transfers to the beta and the delta protons, and the process continues. In total correlation spectroscopy, the alpha and all the other protons are able to transfer magnetization to the beta, gamma, delta, epsilon if they are connected by a continuous chain of protons. The continuous chain of protons are the sidechain of the individual amino acids.
Thus these two experiments are used to build so called spin systems, that is build a list of resonances of the chemical shift of the peptide proton, the alpha protons and all the protons from each residue’s sidechain. Which chemical shifts corresponds to which nuclei in the spin system is determined by the conventional correlation spectroscopy connectivities and the fact that different types of protons have characteristic chemical shifts. To connect the different spinsystems in a sequential order, the nuclear Overhauser effect spectroscopy experiment has to be used. Because this experiment transfers magnetization through space, it will show crosspeaks for all protons that are close in space regardless of whether they are in the same spin system or not. The neighbouring residues are inherently close in space, so the assignments can be made by the peaks in the NOESY with other spin systems.

Figure 3.36: Comparison of a COSY and TOCSY 2D spectra for an amino acid like glutamate or methionine. The TOCSY shows off diagonal crosspeaks between all protons in the spectrum, but the COSY only has crosspeaks between neighbours.
Image from Kjaergaard
One important problem using homonuclear nuclear magnetic resonance is overlap between peaks. This occurs when different protons have the same or very similar chemical shifts. This problem becomes greater as the protein becomes larger, so homonuclear nuclear magnetic resonance is usually restricted to small proteins or peptides.
If recombinant proteins can be produced, the resulting protein can be labelled with Nitrogen-15 or with Carbon-13 to allow for more detailed experimentation, such as heteronuclear single quantum coherence spectroscopy (HSQC). The most commonly performed 15N experiment is the 1H-15N HSQC. The experiment is highly sensitive and therefore can be performed relatively quickly. It is often used to check the suitability of a protein for structure determination using NMR, as well as for the optimization of the sample conditions. It is one of the standard suite of experiments used for the determination of the solution structure of protein. The HSQC can be further expanded into three- and four dimensional NMR experiments, such as 15N-TOCSY-HSQC and 15N-NOESY-HSQC (Figure 3.37).
1H–15N HSQC spectrum of a fragment of an isotopically labeled protein NleG3-2. Each peak in the spectrum represents a bonded N-H pair, with its two coordinates corresponding to the chemical shifts of each of the H and N atoms. 1H–15N HSQC spectrum of a fragment of an isotopically labeled protein NleG3-2. Each peak in the spectrum represents a bonded N-H pair, with its two coordinates corresponding to the chemical shifts of each of the H and N atoms.
Figure 3.37 1H–15N HSQC spectrum of a fragment of an isotopically labeled protein NleG3-2. Each peak in the spectrum represents a bonded N-H pair, with its two coordinates corresponding to the chemical shifts of each of the H and N atoms.
Image from: Wu, B., et. al. (2010) PLoS Pathogens 6(6):e1000960.
Cryo-electron Microscopy
Cryogenic-electron microscopy (cryo-EM) has recently emerged as a powerful technique in structural biology that is capable of delivering high-resolution density maps of macromolecular structures (Fig. 3.38). Resolutions approaching 1.5 Å are now possible and maps in the 1–4-Å range inform the construction of atomistic models with a high degree of confidence. This new capacity for investigators to determine macromolecular structures at high resolution and without the need for crystallogenesis has led to an explosion of interest in adopting cryo-EM.
Protein suspensions are frozen on 3-mm-diameter transmission-electron microscope (TEM) support grids made from a conductive material (e.g. Cu or Au) that are coated with a carbon film with a regular array of perforations 1–2 μm in diameter. A total of 3–5 μl of sample is loaded onto the grid which is then immediately blotted with filter paper with the aim of creating a film of buffer/protein on the grid that, when frozen, will be thin enough for the electron beam to penetrate. Optimising the ice thickness is a vital step in sample preparation as thicker layers of ice increase the probability that the incident electron will undergo multiple scattering events and thereby reduce the image quality. In the case of extreme ice thickness, the electron beam does not penetrate at all. After blotting, the grid is rapidly plunged into a bath of liquid ethane—a very effective cryogen that freezes water with sufficient rapidity as to prevent formation of ice crystals. The formation of a vitreous layer of ice is the fundamental step in cryo-EM and preserves the target in a near-native state. The resulting vitreous ice layer with suspended protein molecules must then remain close to liquid nitrogen temperature (− 196 °C) during storage and imaging in the TEM to prevent phase changes to other types of ice that are not amenable to high-quality imaging and preservation of protein structure.
Image formation in cryo-EM is primarily by phase contrast, although between 7 and 10% of image contrast is from amplitude contrast. Amplitude contrast, where an electron is scattered to such an extent it is removed by an aperture or energy filter along the path of the TEM column, is generally not considered, as the information obtained is usually low resolution compared with phase contrast.
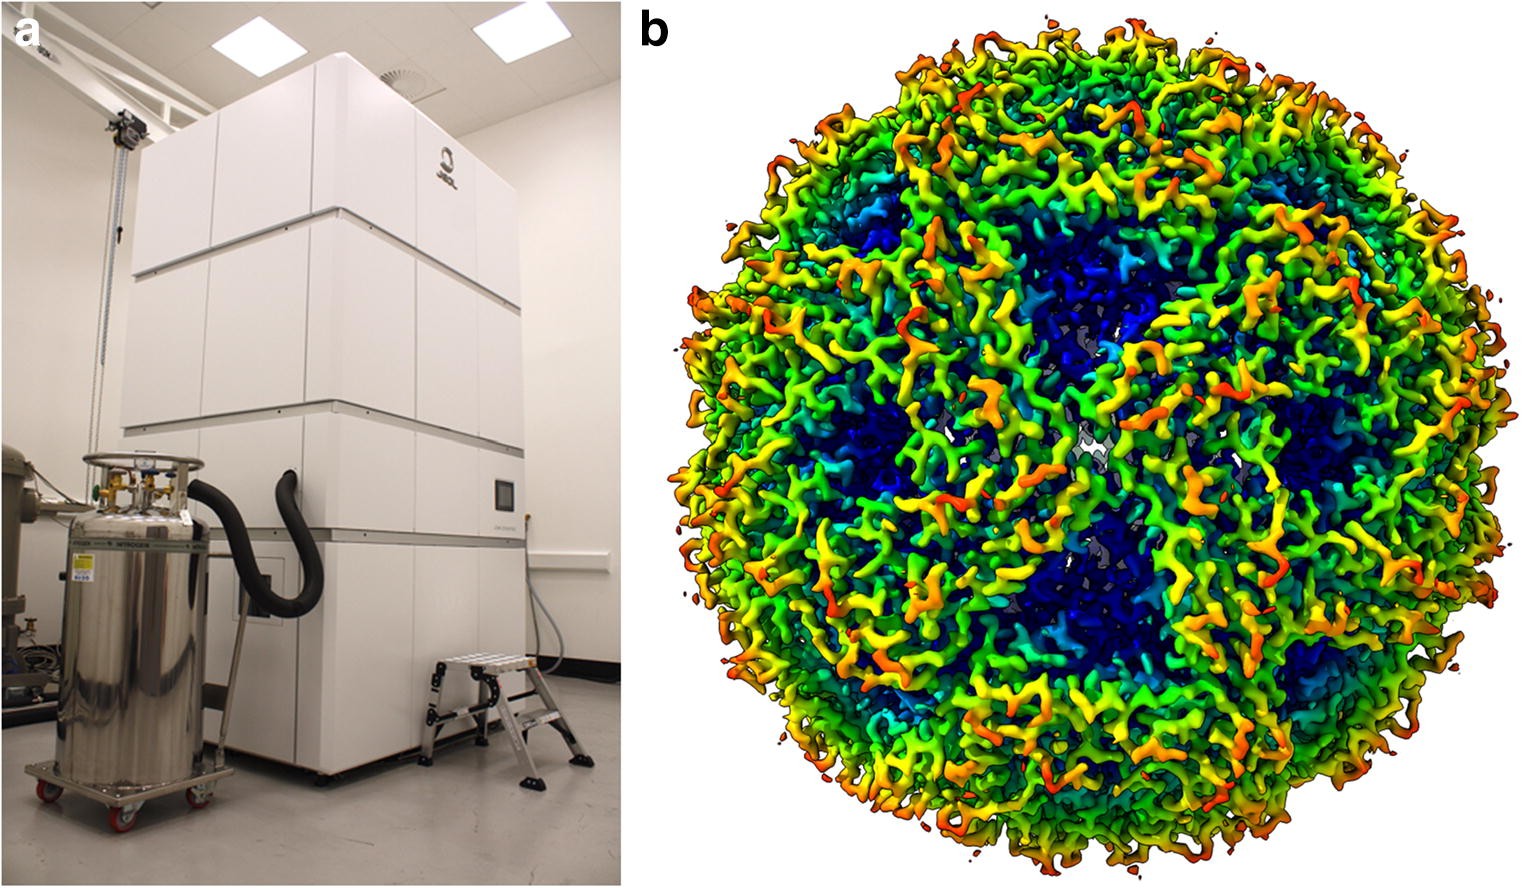
Figure 3.38 Cryo-Electron Microscopy. (a) the Scottish Centrel for Macromolecular Imaging JEOL CryoARM 300. (b) High-resolution 2.2-Å resolution structure of lumazine synthase.
Figure from: Bhella, D. (2019) Biophysical Reviews 11:515-519
Advantages and Disadvantages to Structure Elucidation
Obtaining a pure, highly concentrated (mM) protein sample is a major bottleneck for both x-ray crystallography and NMR. The high concentration is required because both techniques are insensitive to single molecule analysis, and a large population of a particular protein is required to overcome the signal-to-noise barrier. On a similar note the sample needs to be very homogenous, so protein purification is necessary at some point. Cryo-EM requires considerably less protein than for the other two methods, but still ‘a lot’ by any standard. Typically, Cryo-EM requires preparations at a concentration of 1 mg/ml in a volume of at least 50 μl, whereas crystallogenesis migh require 500 μl of protein at a concentration of 5 -10 mg/ml. Cryo-Em also requires the protein to be prepared in a low-salt buffer, with minimal additives, to ensure good freezing and image contrast.
Recombinant protein production using E. coli is the method of choice when large quantities of protein are required. This process involves taking the gene (often cDNA) of the protein of interest, splicing it into a suitable inducible vector, transforming the vector into an E. coli host, and growing the culture in a rich medium. The bacterial host will multiply during a growth phase, after which it is induced to express the protein of interest. If all goes well, the protein will express solubly and in high numbers. Unfortunately, this process is easier said than done. Many eukaryotic proteins do not express well in prokaryotic hosts, and oftentimes modifications need to be made to optimize the bacterial host, codon usage, media, etc. to obtain a decent yield of recombinant protein. Additionally, proteins often express insolubly as inclusion bodies and require high concentrations (2M to 8M) of denaturants such as urea or guanidine hydrochloride to solubilize them, and then stepwise dialysis into an appropriate buffer to refold them. Alternatively, eukaryotic organisms such as S. cerevisiae (yeast), insect and mammalian cell lines can be used, especially when post-translation modifications are required, though a decrease in yield and increase in overall cost is common with these organisms.
The difficulty of protein production is compounded for NMR by the fact that all proteins need to be 15N and/or 13C labeled, as only these isotopes have nuclei with + ½ and – ½ spin states which enable the energy transitions required for a radiofrequency NMR signal; note that 1H also has ½ spin states but is highly abundant.
Protein stability is an issue for both crystallography and NMR. Once a protein has been expressed, purified, and concentrated, it must maintain its structural integrity for the duration of the experiments. For crystallography, this involves the crystallization process, where the protein sample is placed in a variety of solutions (most often involving high concentrations of polyethylene glycol) that induce crystallization. Often referred to as a voodoo technique, crystallization conditions are tested in a high throughput method using 96-well screening plates, and any hits are further optimized using a larger volume of the particular solution. While a crystallization condition may eventually be found, the process can take anywhere from a few days to even a year or two to happen, making the crystallization process the rate-limiting step for protein crystallographers. During this time, the protein must stay in solution and maintain its structure so as to produce a high quality crystal; a condition that is not often the case.
Similarly, a stable, highly concentrated protein sample is required to perform many of the more advanced NMR experiments. This is because many of these experiments require days and even weeks to run, during which the homogeneity of the solution is key to acquiring quality spectra. Should the protein unfold or precipitate out of solution during an experiment, the resulting chemical change would either not produce any signal, or one which could not be used for structure/dynamics determination.
For Cryo-EM, working with frozen-hydrated specimens brings a number of challenges both for manipulations and imaging. When handling cryo-EM grids to load them into the microscope, exposure to atmospheric water vapour rapidly leads to frost buildup on the grid. Under the TEM, these ice crystals on the grid surface appear as huge boulders that completely block the electron beam. Thus, grids are kept under liquid nitrogen as much as possible to minimize frost contamination. Problems with ice conditions are common—insufficient rapid freezing leads to formation of hexagonal ice, while devitrification occurs when samples warm up, leading to formation of cubic ice. Various degrees of contamination may occur, and frosting at atmospheric pressure causes the above-mentioned ice crystal deposition, while contamination within the column or under low-vacuum conditions gives rise to a more subtle artefact.
One of the hallmarks of protein crystallography is that size does not matter. Whether one is working with a 25 kDa monomeric protein, or a 900 kDa multimeric complex, if it can be crystallized and produce a high-resolution diffraction pattern its structure can be determined. This is due to the fact that once in crystal form, a protein is in a more-or-less static conformation which, after passing it through the x-ray beam at different angles, can produce a single structural model. Cryo-EM is similar in this regard. Very large structures, including massive nucleoprotein complexes, such as the ribosome, can be elucidated using Cryo-EM. The same cannot be said for NMR.
In NMR, the protein is in a soluble state and therefore in constant movement. The most important movement that governs the spectral quality is that of the molecular tumbling rate. For proteins larger than about 40 kDa, the tumbling rate decreases significantly, in turn increasing the transverse relaxation rate (T2). Essentially, this results in a weaker and rapidly decaying NMR signal, which manifests itself in peak broadening and spectral overlap.
One of the major advantages of NMR is its ability to record small and large-scale protein dynamics, a phenomenon that is generally suppressed when a protein is crystallized. Although a crystallized protein may exhibit a certain amount of motion within the lattice, the motions manifest themselves as static or dynamic disorder, the former of which may result in two different conformations of a particular region, and the latter in averaged electron density. In general, crystallization may restrict a protein’s natural flexibility and motions. Cryo-EM suffers from this same limitation as samples are frozen and immobile. However, cryo-EM is capable of capturing a snap shot of the native structure as freezing is instantaneous and does not require the formation of a crystal lattice.
Crystallography, however, is not left in the cold when it comes to dynamic structure analysis. Time-resolved crystallography can be used to monitor changes in the protein structure upon addition of some ligand, or change in the environment. Because all protein crystals are highly hydrated, they are able to serve as crucibles for some biochemical reactions. The crystal is typically soaked in a solution containing the ligand of interest to initiate the biochemical reaction, after which the crystal is quickly placed into the beam-line and diffraction pattern is obtained. This can be performed multiple times if necessary to obtain a variety of structural intermediates. The process though requires many things to go right: the protein cannot become disordered nor should the crystal become cracked during the soaking process, and a high-powered synchrotron is required to collect high-quality diffraction data over short exposure times.
In the end, protein x-ray crystallography, cryo-EM and NMR spectroscopy are not mutually exclusive techniques; one can easily pick up where the other falls short. In analyzing NMR dynamics experiments, for example, one can greatly benefit from existing crystal structure data, or cryo-EM data onto which the NMR structural data can be superimposed. Similarly, NMR structure data can be used to supplement a cryo-EM or crystal structure with more information on the protein’s dynamics, binding information, and conformational changes in solution.
back to the top
3.5 Proteome Analysis
The proteome is the entire set of proteins that is produced or modified by an organism or system. Proteomics has enabled the identification of ever increasing numbers of protein. This varies with time and distinct requirements, or stresses, that a cell or organism undergoes. Proteomics is an interdisciplinary domain that has benefitted greatly from the genetic information of various genome projects, including the Human Genome Project. It covers the exploration of proteomes from the overall level of protein composition, structure, and activity. It is an important component of functional genomics.
After genomics and transcriptomics, proteomics is the next step in the study of biological systems. It is more complicated than genomics because an organism’s genome is more or less constant, whereas proteomes differ from cell to cell and from time to time. Distinct genes are expressed in different cell types, which means that even the basic set of proteins that are produced in a cell needs to be identified.
In the past this phenomenon was assessed by RNA analysis, but it was found to lack correlation with protein content. Now it is known that mRNA is not always translated into protein, and the amount of protein produced for a given amount of mRNA depends on the gene it is transcribed from and on the current physiological state of the cell. Proteomics confirms the presence of the protein and provides a direct measure of the quantity present.
A cell may make different sets of proteins at different times or under different conditions, for example during development, cellular differentiation, cell cycle, or carcinogenesis. Further increasing proteome complexity, as mentioned, most proteins are able to undergo a wide range of post-translational modifications.
Therefore, a proteomics study may become complex very quickly, even if the topic of study is restricted. In more ambitious settings, such as when a biomarker for a specific cancer subtype is sought, the proteomics scientist might elect to study multiple blood serum samples from multiple cancer patients to minimise confounding factors and account for experimental noise. Furthermore, many proteins undergo postranslational modifications such as phosphoyrlation. Many of these post-translational modifications are critical to the protein’s function. Thus, complicated experimental designs are sometimes necessary to account for the dynamic complexity of the proteome.
3.6 References
Molnar, C. and Gair, J. (2013) Antibodies. Chapter in Concepts in Biology, Published by B.C. Open Textbook Project. Available at: https://opentextbc.ca/biology/chapter/23-3-antibodies/
The Human Atlas Project. (2019) Methods. Available at: https://www.proteinatlas.org/learn/method
Uhlén M et al, 2015. Tissue-based map of the human proteome. Science
PubMed: 25613900 DOI: 10.1126/science.1260419
Thul PJ et al, 2017. A subcellular map of the human proteome. Science.
PubMed: 28495876 DOI: 10.1126/science.aal3321
Uhlen M et al, 2017. A pathology atlas of the human cancer transcriptome. Science.
PubMed: 28818916 DOI: 10.1126/science.aan2507
Ahern, K. and Rajagopal, I. (2019) Biochemistry Free and Easy. Published by Libretexts. Available at: https://bio.libretexts.org/Bookshelves/Biochemistry/Book%3A_Biochemistry_Free_and_Easy_(Ahern_and_Rajagopal)/09%3A_Techniques/9.04%3A_Gel_Exclusion_Chromatography.
Magdeldin, S. (2012) Gel Electrophoresis – Principles and Basics. Published by InTech under Creative Commons Attribution 3.0. Available at: https://pdfs.semanticscholar.org/4b93/70ac3946cec6e12c369679c4178a5ef38e61.pdf
Structural Biochemistry/Proteins/X-ray Crystallography. (2018, November 19). Wikibooks, The Free Textbook Project. Retrieved 15:40, August 17, 2019 from https://en.wikibooks.org/w/index.php?title=Structural_Biochemistry/Proteins/X-ray_Crystallography&oldid=3488057.
UCD: Biophysics 200A (2019) “NMR Spectroscopy vs X-ray Crystallography”, Chapter published in Current Techniques in Biophysics. Published by Libretexts and available at: https://phys.libretexts.org/Courses/University_of_California_Davis/UCD%3A_Biophysics_200A_-_Current_Techniques_in_Biophysics/NMR_Spectroscopy_vs._X-ray_Crystallography
Wikipedia contributors. (2019, June 27). Protein purification. In Wikipedia, The Free Encyclopedia. Retrieved 23:32, July 28, 2019, from https://en.wikipedia.org/w/index.php?title=Protein_purification&oldid=903657925
Wikipedia contributors. (2019, February 15). Fast protein liquid chromatography. In Wikipedia, The Free Encyclopedia. Retrieved 17:14, August 15, 2019, from https://en.wikipedia.org/w/index.php?title=Fast_protein_liquid_chromatography&oldid=883530035
Wikipedia contributors. (2019, July 9). Protein mass spectrometry. In Wikipedia, The Free Encyclopedia. Retrieved 15:27, August 16, 2019, from https://en.wikipedia.org/w/index.php?title=Protein_mass_spectrometry&oldid=905547289
Wikipedia contributors. (2019, July 8). Peptide synthesis. In Wikipedia, The Free Encyclopedia. Retrieved 06:13, August 17, 2019, from https://en.wikipedia.org/w/index.php?title=Peptide_synthesis&oldid=905401648
Wikipedia contributors. (2019, July 11). Edman degradation. In Wikipedia, The Free Encyclopedia. Retrieved 06:16, August 17, 2019, from https://en.wikipedia.org/w/index.php?title=Edman_degradation&oldid=905808326
Bhella, D. (2019) Cryo-electron microscopy: an introduction to the technique, and considerations when working to establish a national facility. Biochysical Reviews 11: 515-519. Available at: https://link.springer.com/article/10.1007/s12551-019-00571-w

