Home » Student Resources » Online Chemistry Textbooks » CH450 and CH451: Biochemistry - Defining Life at the Molecular Level » Chapter 1: The Foundations of Biochemistry
MenuCH450 and CH451: Biochemistry - Defining Life at the Molecular Level
Chapter 1: The Foundations of Biochemistry
1.1 Cellular Foundations
1.2 Physical Foundations
1.3 Chemical Foundations
1.4 Genetic, Epigenetic and Evolutionary Foundations
1.5 References
1.1 Cellular Foundations
You have probably studied the cell many times, either in high school, or in college biology classes. There are many websites available that review both prokaryotic (bacterial and archeal cell types) and eukaryotic cells (protist, fungi, plant, and animal cell types). All cells have some similar structural components, including genetic material in the form of chromosomes, a membrane bound lipid bilayer that separates the inside of the cell from the outside of the cell, and ribosomes that are responsible for protein synthesis. This tutorial is designed specifically from the viewpoint of chemistry. It explores four classes of biomolecules that are also present in all cell types (lipids, proteins, nucleic acids and carbohydrates) and describes in a simplified pictorial manner where they are found, made, and degraded in a typical eukaryotic, animal cell (i.e. their history). This cell review focuses on the organelle structures common in eukaryotic cells. Subsequent chapters will concentrate on the structure and function of specific biomolecules.
Let’s think of a cell as a chemical factory which designs, imports, synthesizes, uses, exports and degrades a variety of chemicals (in the case of the cell, these include lipids, proteins, nucleic acids and carbohydrates). It also must determine or sense the amount of raw and finished chemicals it has available and respond to its own and external needs by ramping up or shutting off production. Biochemistry is the branch of science dedicated to the study of these chemical processes within a cell. Understanding these processes can also lend insight into disease states and the pharmacological effects of toxins, drugs, and other medicines within the body. This section will review key structural and functional properties of the cell.
Metabolism – Synthesis and Degradation
The building and breaking down of life-sustaining chemicals within an organism is known as Metabolism. Overall, the three main purposes of metabolism are: (1) the conversion of food to energy to run cellular processes; (2) the conversion of food/fuel to building blocks for the production of primary metabolites, such as proteins, lipids, nucleic acids, and other secondary metabolites; and (3) the elimination of waste products. These enzyme-catalyzed reactions allow organisms to grow and reproduce, maintain their structures, and respond to their environments.
Metabolic reactions may be categorized as catabolic– the breaking down of compounds (for example, the breaking down of proteins into amino acids during digestion); or anabolic – the building up (synthesis) of compounds (such as proteins, carbohydrates, lipids, and nucleic acids). Usually, catabolism releases energy, and anabolism consumes energy.
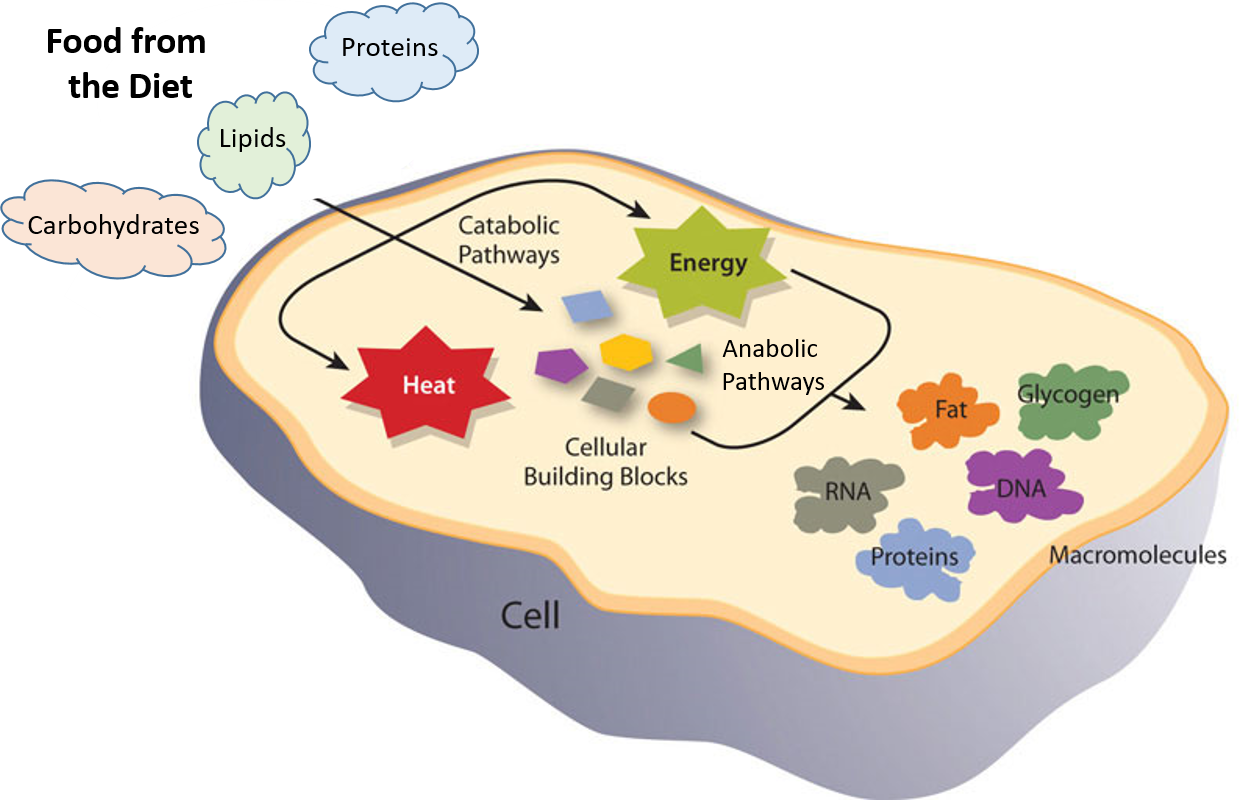
Figure 1.1 Catabolic and Anabolic Reactions. Catabolic reactions involve the breakdown of molecules into smaller components, whereas anabolic reactions build larger molecules from smaller molecules. Catabolic reactions usually release energy whereas anabolic processes usually require energy.
Figure is modified from Metabolism Overview
The chemical reactions of metabolism are organized into metabolic pathways, in which one chemical is transformed through a series of steps into another chemical, each step often being facilitated by a specific enzyme. Enzymes are crucial to metabolism because enzymes act as catalysts – they allow a reaction to proceed more rapidly. In addition, enzymes can provide a mechanism for cells to regulate the rate of a metabolic reaction in response to changes in the cell’s environment or to signals from other cells, through the activation or inhibition of the enzyme’s activity. Enzymes can also allow organisms to drive desirable reactions that require energy that will not occur by themselves, by coupling them to spontaneous reactions that release energy. Enzyme shape is critical to the function of the enzyme as it determines the specific binding of a reactant. This can occur by a lock and key model where the reactant is the exact shape of the enzyme binding site, or by an induced fit model, where the contact of the reactant with the protein causes the shape of the protein to change in order to bind to the reactant. The catalytic mechanisms, kinetics, and regulatory pathways of enzymes will be studied in detail within this text.
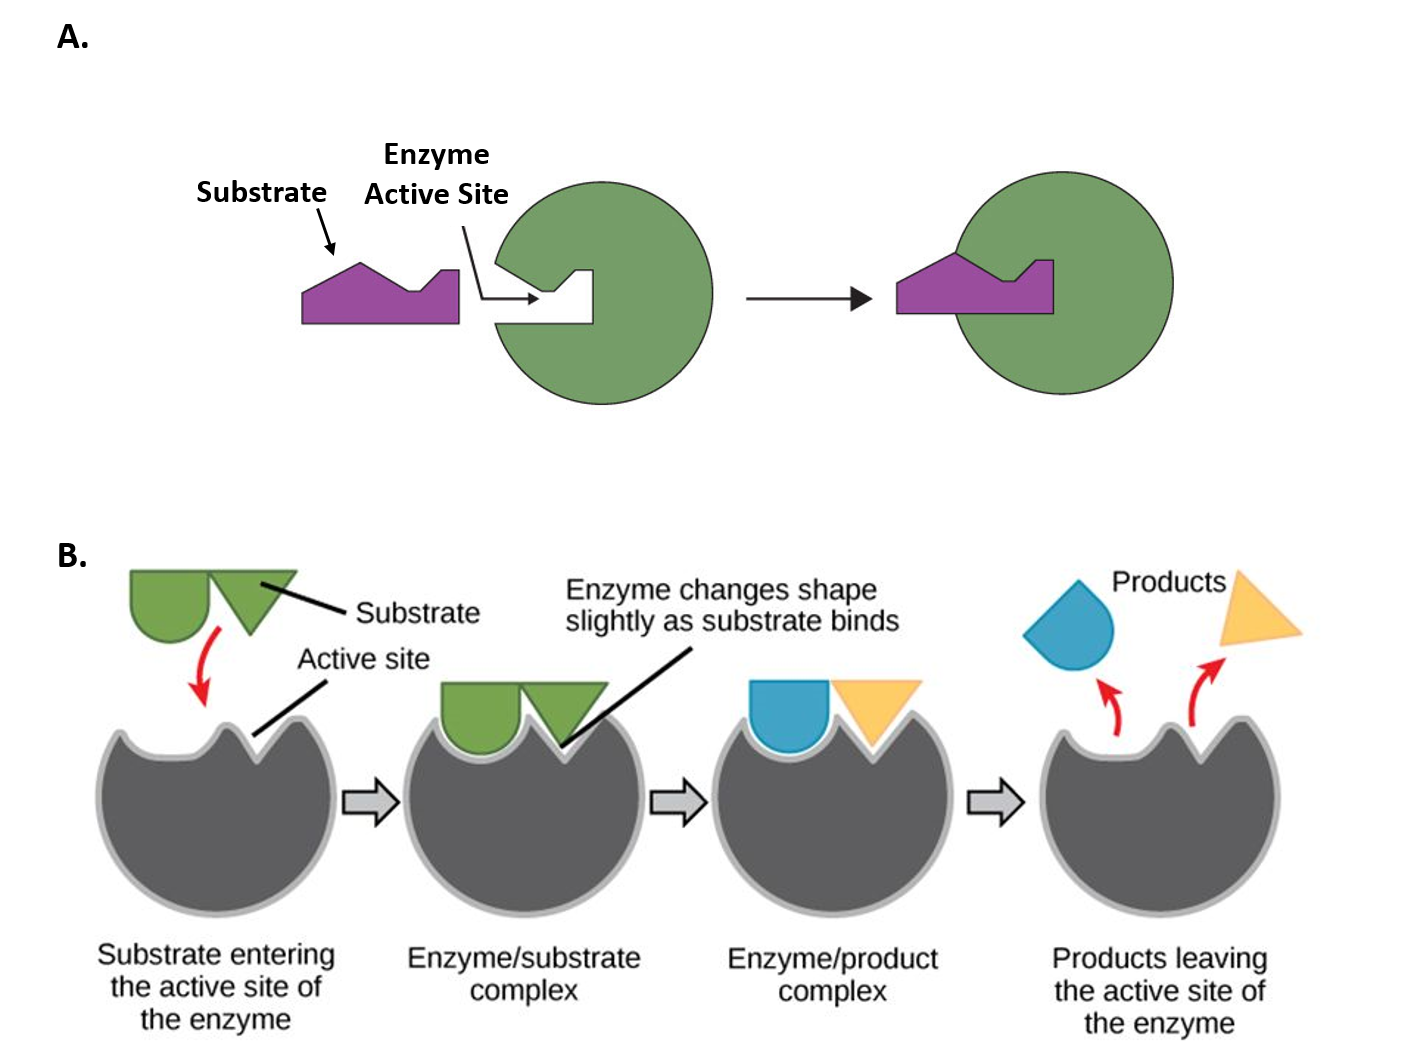
Figure 1.2 Mechanisms of Enzyme-Substrate Binding. (A) In the Lock and Key Model, substrates fit into the active site of the enzyme with no further modifications to the enzyme shape required. (B) In the Induced Fit Model, substrate interaction with the enzyme causes the shape of the enzyme to change to better fit the substrate and mediate the chemical reaction.
Figure 1.2A was modified from Socratic and Figure 1.2B was modified from Concepts in Biology
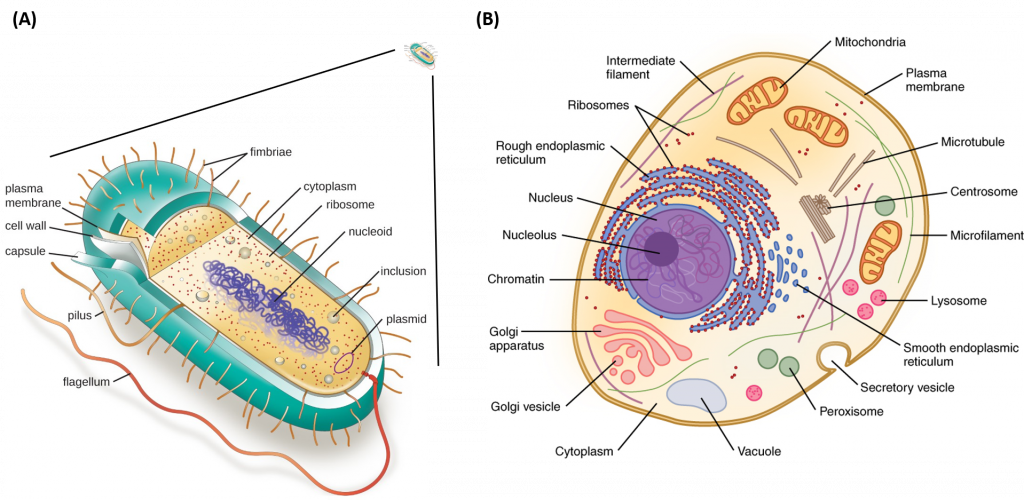
Metabolism is a feature of all cellular life, from the very simplistic prokaryotic cells (Archae and Bacterial cells) to the more complex eukaryotic cells (Fungi, Animal and Plant cells) (Fig. 1.3). Prokaryotic cells and eukaryotic cells are defined by major differences in size and structural features. Prokaryotic cells are simplistic cells that are approximately 1,000 times smaller than their eukaryotic counterparts. All prokaryotes have a single, circular chromosome located in a nucleoid region of the cell, as well as ribosomes that produce proteins that perform cellular metabolic functions. Prokaryotic cells also contain a plasma membrane and external cell wall structure. Some prokaryotes also have cilia or flagella that aid in locomotion.
Figure 1.3 Structure of Prokaryotic and Eukaryotic Cell Types. Depiction of the relative size of a prokaryotic cell (A) which is approximately 1,000 times smaller that a eukaryotic cell (B). All prokaryotic cells contain a chromosomal DNA that is concentrated in a nucleoid, ribosomes, and a cell membrane-cell wall system. Some prokaryotic cells may also possess flagella, pili, fimbriae, and capsules. Eukaryotic cells are much larger than procaryotic cells and require the additional compartmentalization of structures into membrane-bound organelles to mediate metabolic functions.
Images modified from: LumenLearning Microbiology Online Textbook and OpenStax Anatomy and Physiology Online Textbook
Eukaryotic cells, on the otherhand, are much larger and require more compartmentalization to adequately perform metabolic functions. They have a true nucleus surrounded by a complex nuclear membrane that houses multiple, linear chromosomes. Within eukaryotic cells, the metabolic machinery present allows for the construction of membrane-bound organelle structures that help to compartmentalize cellular functions. Therefore, organelles can be thought of as ‘little organs’ within the cell having discrete cellular functions. The figure of the animal cell below (Fig 1.4) and in the other linked sites based on it was made available with the kind permission of Liliana Torres. Click on the blue hyperlinks for some of the organelles for more detailed information on them.
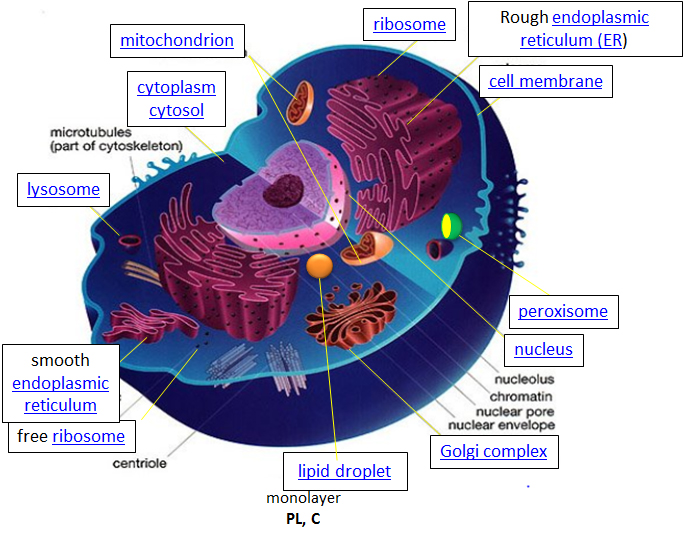
Figure 1.4 Structure of a Typical Eukaryotic Animal Cell.
The original figure was acquired from Liliana Torres at: http://torresbioclan.pbworks.com/w/page/22377234/Spikefish%20About%20Cells
Use with permission from Liliana Torres. Also at http://www.animalport.com/animal-cells.html
Cellular Design and the Blueprint of Life
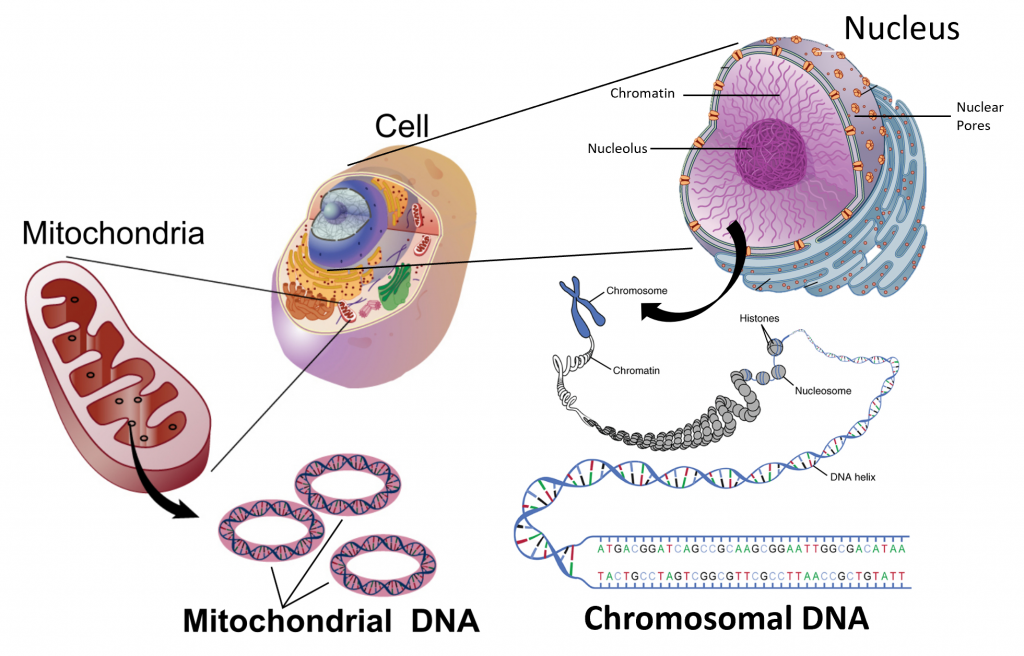
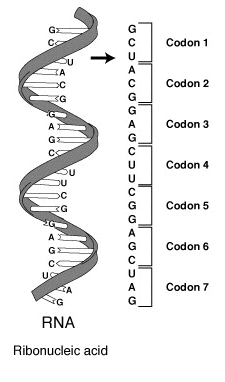
The design for a cell mostly resides in the blueprint for the cell, the genetic code, which is comprised of deoxyribonucleic acid (DNA) housed in the cell nucleus and a small amount in the mitochondria (Figure 1.5). Of course, the DNA blueprint must be read out or transcribed into ribonucleic acid (RNA) and then translated to proteins by ribozome structures, which themselves were encoded by the DNA and contain a combination of RNA and protein subunits. The genetic code has the master plan that determines the sequence of all cellular proteins, which then perform almost all other activities in the cell, including enzymatic functions, motility, architectural structure, transport, etc. In contrast to DNA, RNA and protein polymers, the formation of the other two major macromolecules (carbohydrates and lipids) are not driven by such a template but rather by the enzymes that catalyzes the synthesis.
Figure 1.5 The Blueprint for Life is Housed in Deoxyribonucleic Acid (DNA). Within eukaryotic cells DNA is localized to two major places within the cell. The first is the nuclear DNA that forms linear chromosome structures (shown on the right). The second is the circular DNA housed in the mitochondria (shown on the left). The mitochonrdial structures replicate independently of the cell and are thought to have originated as prokaryotic symbionts during the early evolution of the eukaryotic cell type.
Images modified from: National Human Genome Research Institute at NIH and OpenStax Anatomy and Physiology
Cellular Import and Export of Molecules
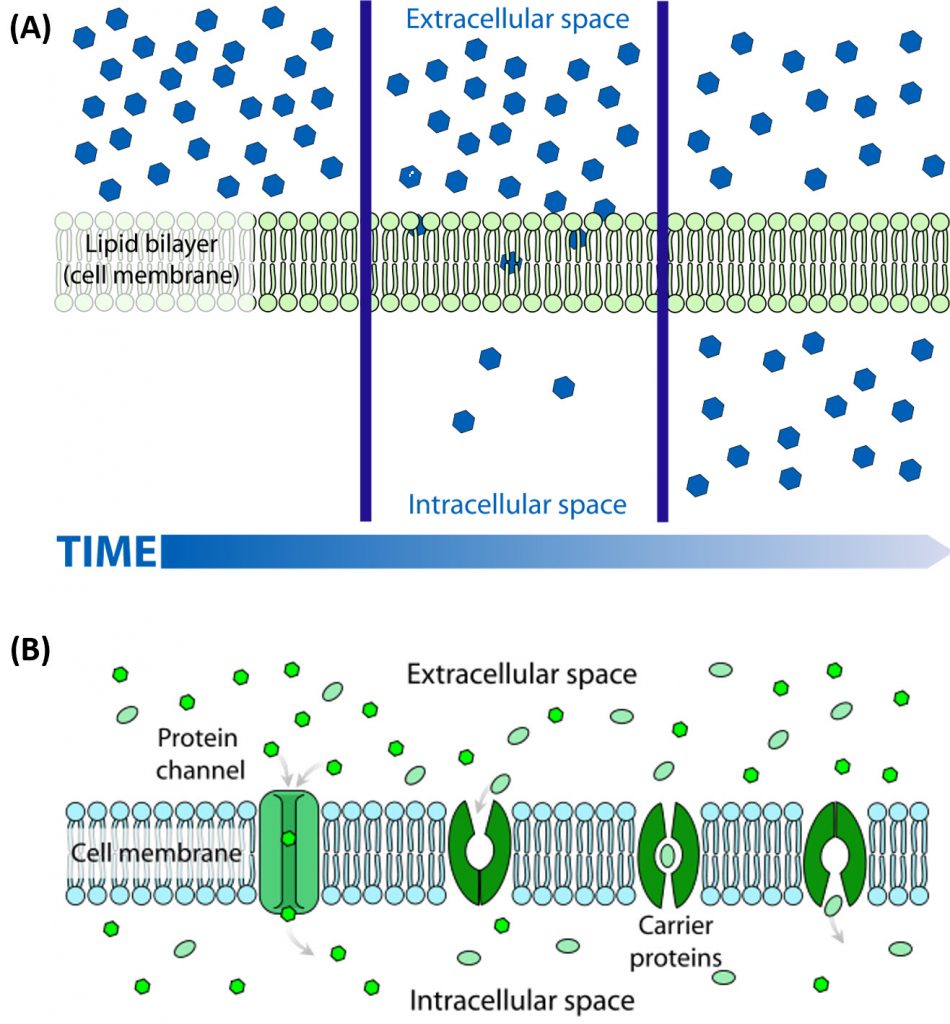
Many of the chemical constituents of the cell arise not from direct synthesis but from import of both small and large molecules. The imported molecules must pass through the nonpolar lipid bilayer that forms the cell membrane, and in some cases through additional membranes if they need to reside inside membrane-bound organelles. Molecules can move into the cell by two major processes, diffusionor active transport. The process of diffusion moves molecules down their concentration gradient from an area of high concentration to an area of low concentration and does not require an input of energy. Active transport, on the other hand, requires energy to move molecules against their concentration gradient from an area of low concentration to an area of high concentration. Diffusion across the plasma membrane can either be passive or facilitated. In passive diffusion, small, nonpolar molecules (such as CO2 and O2) move across the membrane directly across the membrane (Fig 1.6A). Larger and/or polar molecules move by facilitated diffusion, which requires a channel or carrier protein (Fig 1.6B). Computer simulations of the facilitated diffusion of lactose or water across the membrane are shown at the following links: Animation of lactose diffusion through the LacY protein and Animation of water diffusion through the aquaporin channel, (These animations were created by the Theoretical and Computational Biophysics group at the Beckman Institute, University of Illinois at Urbana-Champaign. These molecular dynamic simulations were made with VMD/NAMD/BioCoRE/JMV/other software support developed by the Group with NIH support.)
Ion channels are specialized channels that allow the flow of ions across membranes. Some are permanently open (nongated) while others open or close depending on the presence of ligands (ligand gated) that bind the protein channel, the physical bending of the protein within the local environment (mechanical gated), or a change in the voltage/charge state (voltage gated) of the local environment of the protein in the membrane. Flow of ions through the channel proceeds in a thermodynamically favored direction, which depends on their concentration and voltage gradients across the membrane.
Figure 1.6 The Process of Cellular Diffusion. The movement of small, nonpolar molecules across the plasma membrane and down their concentration gradient occurs by passive diffusion (shown in A). Protein channels or carriers are required for the movement of larger and/or polar molecules, such as water, across the plasma membrane (shown in B). Note that diffusion processes will proceed and equalize concentrations of a molecule until a dynamic equilibrium is reached.
Image A and B are from: LadyofHats
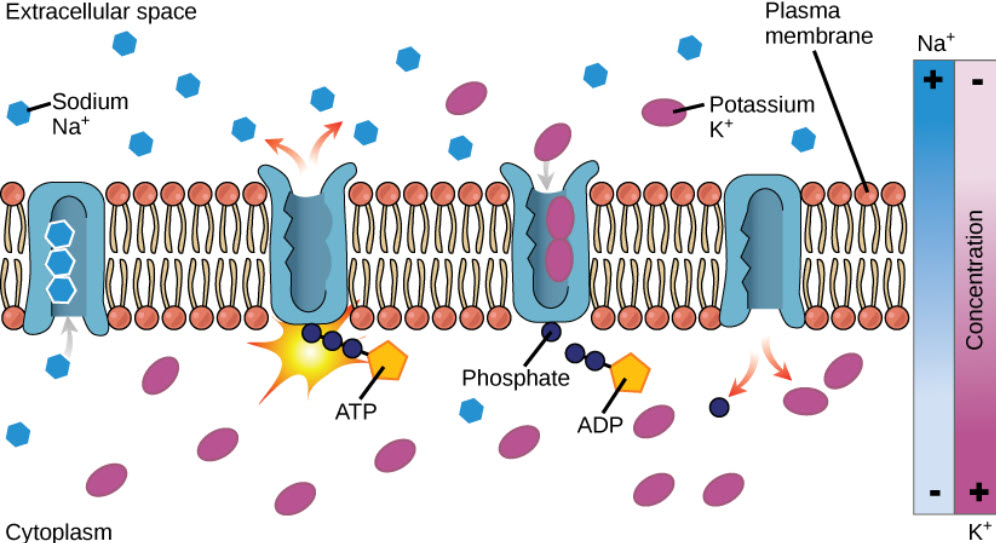
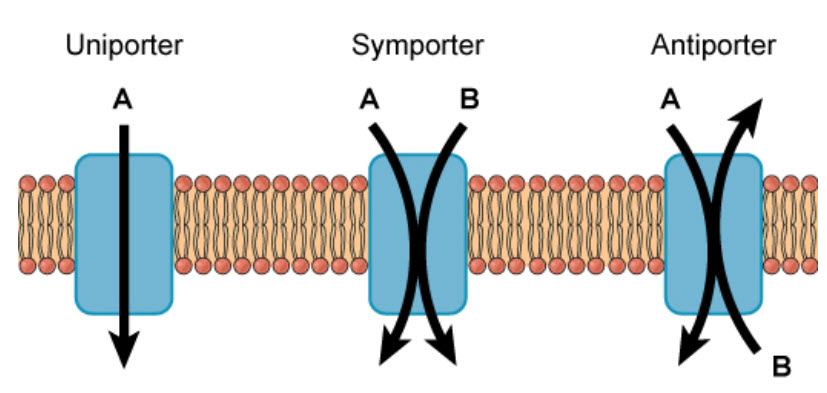
Molecules can also move against a concentration gradient in a process called active transport. Active tranport requires an input of energy, often in the form of ATP hydrolysis (Fig. 1.7). When ATP is used as the energy source, this is known as primary active transport. The Na+/K+ ATPase pump is an important example of active transport and works to set up chemical gradients inside and outside of the cell. For the hydrolysis of one ATP molecule, three Na+ are pumped outside of the cell, while two K+ are pumped inside the cell. Proteins that move two molecules in opposite directions are also known as antiporters (Fig 1.7). Other active transport systems can use the energy of a chemical gradient to move other molecules in the same direction. This is known as secondary active transport. An example of a secondary active transporter is the Na+/glucose symporter, that uses the energy of Na+ moving down its concentration gradient to move glucose into the cell against its concentration gradient. Note that a symporter is a transporter that moves two molecules in the same direction across the plasma membrane (Fig. 1.8).
Figure 1.7 The Na+/K+ ATPase Active Transporter. The Na+/K+ ATPase hydrolyzes ATP to ADP and utilizes the energy released to shuttle three sodium ions outside of the cell and two potassium ions inside of the cell.
Image from Open Stax Biology AP Course
Figure 1.8 Uniporters, Symporters, and Antiporters. Channel, carrier and pump proteins can be classified as uniporters if they only move a single molecule across the plasma membrane, or as symporters if they move two molecules in the same direction, or as antiporters, if they move two molecules across the membrane in opposite directions.
Image from Open Stax Biology AP Course
The pH of the cytosol (the aqueous substance surrounding all the organelles within the cell) is tightly regulated from about 7.0-7.4, depending on the metabolic state of the cell. Some organelles have proton transporters that can significantly alter the pH inside an organelle. For example the pH inside the lysosome, a degradative organelle, is about 4.8. Furthermore, the creation of a pH gradient across the inner mitochondrial membrane is sufficient to drive the thermodynamically unfavored synthesis of ATP. Gradients of protons and other ions within the cell are mediated by activity of ion channels and ion pumps within the plasma membrane.
Compared to the extracellular fluid, the concentration of potassium ion is higher inside the cell, while concentrations of sodium, chloride and calcium ions are higher on the outside of the cell (see table below). These concentration gradients are maintained by ion transporters and channels and require energy expenditure ultimately in the form of ATP hydrolysis. Changes in these concentrations are integral to the signaling system used by the cell to sense and respond to changes in its external and internal environments, including the firing of an action potential by neurons and muscle contraction within myocytes.
The table below show approximate ion concentrations in the cell.
Table 1.1 Average Cellular and Extracellular Ion Concentrations
| Ion | Inside (mM) | Outside (mM) |
| Na+ | 140 | 5 |
| K+ | 12 | 140 |
| Cl- | 4 | 15 |
| Ca2+ | 1 uM | 2 |
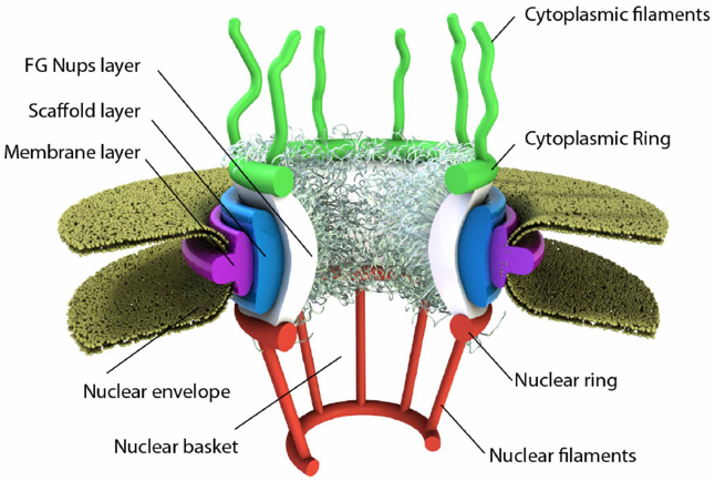
Some membranes, such as the nuclear and outer mitochondrial membranes, assemble proteins complexes to form large, but regulated pore complexes (Fig 1.9). Porin proteins are found in mitochondrial membranes while nucleoporins (Nups) are found in the nuclear membrane. Nuclear pores enable the passive and facilitated transport of molecules across the nuclear envelope. Nups form a family of around 30 proteins and are the main components of the nuclear pore complex in eukaryotic cells. Nuclear pores are able to transport molecules across the nuclear envelope at a very high rate. A single pore is able to transport 60,000 protein molecules across the nuclear envelope every minute. Some Nups family members contain repeating sequences of the amino acids phenylalanine (F) and glycine (G) giving rise to FG peptide repeats. These peptide repeats are thought to give specificity and selectivity to the molecules that can pass through the pore complex.
Figure 1.9 Schematic of the Nuclear Pore Complex. The pore is anchored to the nuclear envelope by a membrane layer that surrounds the scaffold layer. This scaffold layer provides structure and serves as an anchor for Nups that contain both structured domains as well as highly unstructured domains that are thought to form a barrier that excludes non-interacting molecules while allowing for selective transport of others. This central channel exhibits eight-fold rotational symmetry and has eight cytoplasmic filaments as well as eight nuclear filaments protruding into the cytoplasm and nucleoplasm respectively. The nuclear filaments are bound via a ring, resulting in a basket structure. Pores allow for the selective transport of larger molecules through membrane structures, including molecules such as mRNA.
Image from: Azimi, M. and Mofrad, M.R.K. (2013) PLoS One 8(11):e81741
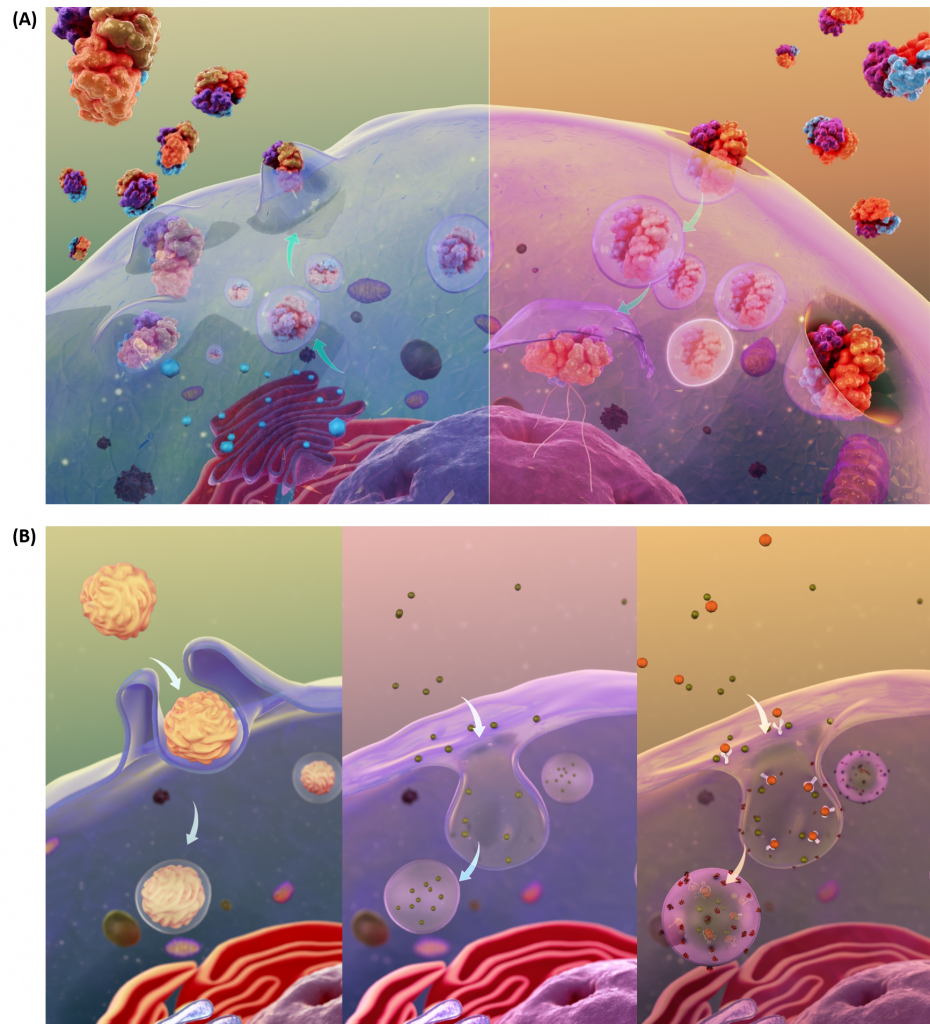
The transport of molecules can also occur through the processes of exocytosis and endocytosis (Fig 1.10A). Large particles, hormones, and other signaling molecules can be packaged into secretory vesicles within the cells and released into the extracellular matrix through the process of exocytosis. Exocytosis occurs when the secretory vesicle fuses with the plasma membrane causing the contents of the vesicle to be exposed to the outside of the cell. New proteins can also be introduced into the plasma membrane during this fusion process. In the reverse process, called endocytosis, very large particles [for example, Low Density Lipoproteins (LDL) and viruses] can be engulfed into the cell. In this process, the plasma membrane invaginates around the materials to be imported into the cell. This invagination eventually pinches off to form an endosomal vesicle. Endocytosis can occur via three major processes: phagocytosis, pinocytosis, and receptor-mediated endocytosis (Fig 1.10B).
Figure 1.10 Schematic Representation of Exocytosis and Endocytosis. In the upper panel (A), exocytosis, depicted on the lefthand side, involves the fusing of secretory vesicles with the plasma membrane to release contents and imbed proteins into the plasma membrane. The reverse process, shown in the upper righthand panel (A), involves the formation of endosomal vesicles as particles from the extracellular matrix are engulfed into the cell. The processes of endocytosis can be further subdivided into three types as shown in (B). The lefthand panel depicts phagocytosis, or the process by which large particles (≥ 0.5 μm) are engulfed by the cell. Pinocytosis, depicted in the lower middle diagram, is known as fluid endocytosis and is the process which small particles suspended in extracellular fluid are brought into the cell. Receptor-mediated endocytosis, also called clathrin-mediated endocytosis, is depicted in the righthand, lower panel and is a process by which cells absorbs metabolites, hormones, proteins – and in some cases viruses – by a receptor-mediated process. This form of endocytosis is strictly mediated by receptors on the surface of the cell.
Images from Scientific Animations
Cellular Structure and Support
The “cytoskeletal” architecture of a (with molecular “cables”- and “girder-like” structures) is not dissimilar from a factory (Figure 1.11).
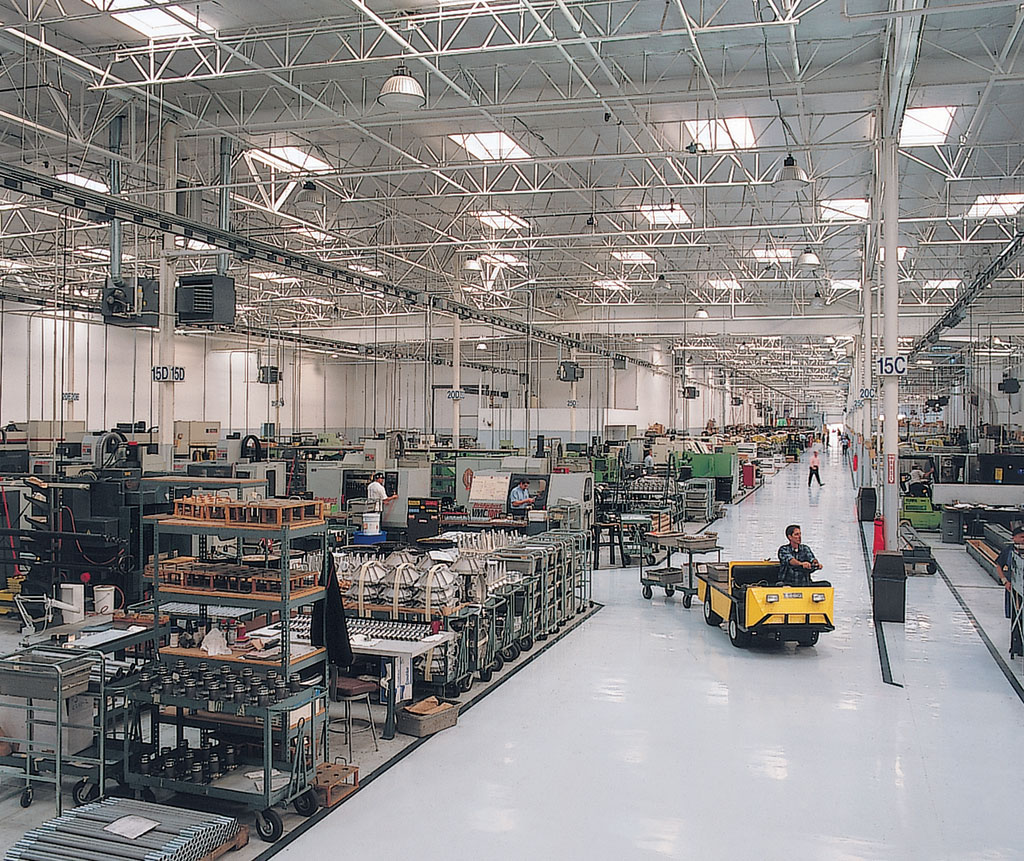 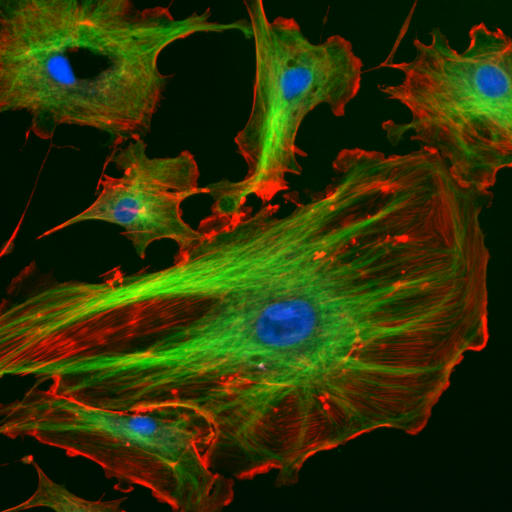 |
| Figure 1.11 Cellular Architecture. The architecture and organization of structural components within a cell (right picture) are analogous to the organization seen within a warehouse (left picture). In the right image, bovine pulmonary artery endothelial cells have been stained to indicate the nucleus (blue color), tubulin cytoskeletal proteins (fluorescent green color), and F-actin cytoskeletal proteins (fluorescent red color).
Source of the factory picture: http://www.cybercom.net/~copters/trips/pictures/factory_inside.jpg Source of the fluorescent cell picture: http://en.wikipedia.org/wiki/File:FluorescentCells.jpg |
The internal framework of a cell or cytoskeleton, is composed of microfilaments, intermediate filaments, and microtubules. These are comprised of monomeric proteins which self assemble to form the internal architecture. Parts of the cytoskeleton can be seen in Figure 1.11.
Microfilaments of actin monomers (which are stained with a red/orange fluorophore) and microtubules which offer more structural support made of tubulin monomers (stained green) along with the blue-stained nucleus, are shown in the image. Organelles are supported and organized by the cytoskeleton (primarily microtubules). Even the cell membrane is supported underneath the inner leaflet by actin (stained orange) and spectrin microfilaments. Motor proteins like myosin (that moves along actin microfilaments) and dynein and kinesin (that move along tubulin microtubules) carry cargo (vesicles, organelles) in a directional fashion. The cell is not a disorganized collection of molecules and organelles. Rather is a highly organized for optimal chemical production, use and degradation.
Cells have a variety of shapes. Some circulating immune cells must slip through the cells that line capillary walls to migrate to sites of infection. The same process occurs when tumor cells metastasize and escape to other sites in the body. In order to do so, the cell must drastically change shape, a response that requires dissociation of the cytoskeleton polymers into monomers which are available later for repolymerization. The following video shows the mobility and flexibility of a Killer T-Cell as it attacks and kills a cancerous cell.
Video 1.1 Killer T Cell Attacking Cancer
Video available on youtube through creative commons by Cambridge University
The Cell is an Amazingly Crowded Place
In chemistry labs, we typically work with dilute solutions of solute molecules in a solvent. You have probably heard that the body is comprised of 68% water, but the water concentration is obviously dependent on the cellular environment. Solute molecules like protein and carbohydrates are densely packed. Cells are so crowded that the space between larger molecules like protein is typically smaller than that of a single protein. Studies have shown that the stability of a protein is increased in such conditions, which would help keep the protein in the correctly folded, native state. Another consequence of high intracellular concentrations is that it limits the diffusion of molecules throughout the cell, as would be expected from an equilibrium perspective in dilute solutions. Thus, cytoplasmic cellular functions can be highly localized within specific regions of the cell creating unique microenvironments and higher differentiation potential within a single cell, as depicted in Figure 1.12.
Hence the study of biomolecules in dilute solutions in the lab may not reveal the actual complexities of interactions and activities of the same molecule in vivo. Recently investigators have added a neutral copolymer of sucrose and epichlorhydrine to cells in vitro. These particles induced organization of extracellular molecules secreted by cell, forming an organized extracellular “matrix” which induced the organization of the microfilaments on the inside of the cell as well as inducing changes in cell activity. Furthermore, in vitro enzyme activity of a key enzyme in glycolysis dramatically increases under crowded conditions, indicating that metabolic processes are also dependent on spatial arrangement of the cell. Another result of crowding may be the spatial and temporal association of key enzymes involved in specific metabolic pathways, allowing for the coordinated passage of substrates and products within the colocalized enzyme system.
Figure 1.12: The Crowded Cytoplasm of E. Coli. The computer simulation used 50 different types of the most abundant macromolecules of the E. coli cytoplasm and 1008 individual molecules. Rendering of the cytoplasm model at the end of a dynamics simulation. RNA is shown as green and yellow. This figure was prepared with VMD.
Figure adapted from: Ufrom McGuffee SR, Elcock AH (2010) PLoS Comput Biol 6(3): e1000694. doi:10.1371/journal.pcbi.1000694 (open source journal)
Cell Components Undergo Phase Transitions to Form Substructures within the Cell.
A perplexing question is how do substructures form within a cell. This includes not only the biogenesis of organelles like mitochondria but also smaller particle such as polysaacharide granules, lipid droplets, protein/RNA particles (including the ribosome) as well as the nucleolus of the cell nucleus. It might be easiest to consider this problem using two examples from the lipid world, lipid droplets and membrane rafts. You are very familiar with phase transitions that occur when a sparing soluble nonpolar liquid is added to water. At a high enough concentration, the solubility of the nonpolar liquid is exceeded and a phase transition occur as evidenced by the appearance of two separate liquid phases. The same process occurs when triglycerides coalesce into lipid droplets with proteins associated on their outside. Another example occurs within a cell membrane when lipids with saturated alkyl chains self associate with membrane cholesterol (which contains a rigid planar ring system) to form a membrane microdomain called a lipid raft (Figure 1.13). Lipid rafts are characterized by greater packing efficiency, rigidity and thickness that other parts of the membrane. These lipid rafts often recruit proteins involved in signaling processes within the cell membranes. This process of phase separation is also called liquid/liquid demixing as two “liquid-like” substances separate.

Figure 1.13 Architecture of a Lipid Raft. Microenvironments, such as lipid rafts, can form within the lipid bilayer of the plasma membrane (A) Depicts the intracellular side of the plasma membrane with section 2 highlighting the lipid raft structural domain. The extracellular side of the membrane (B) contains an abundance of lipids that are modified with sugar functional groups, demonstrating that lipids in the outer leaflet of the plasma membrane can be dramatically different from the population that reside on the inner leaflet. The prevalence and structure of lipid rafts has recently been associated with a number of diseases states including cancer and may contribute to disease progression.
Image from: Artur Jan Fijałkowski
In a similar manner, it appears that proteins that interact with RNA are composed of less diverse amino acid sequences and have more flexible (“more liquid-like) structures allowing their preferential interaction with RNA to form large RNA-protein particles (like the ribosome and other RNA processing structures) in a fashion that mimics liquid/liquid demixing. All of these interactions are just manifestations of the various intermolecular forces that can exist between molecules. These include ionic interactions, ion-dipole interactions, dipole-dipole interactions, and London dispersion forces (A review of intermolecular forces can be found by Kahn Academy on youtube).
In the upcoming chapters, we will explore the unique structures and functions of the major macromolecules within the body, including nucleic acids, protein, c
back to the top
1.2 Physical Foundations
Reactions and Energy Changes
As you learned in general chemistry, some reactions will go to completion and will be irreversible in nature, while other reactions form an equilibrium between the reactants and the products, and can move in the forward or the reverse direction. Why do reactions vary in extent from completely irreversible in the forward reaction to reversible reactions favoring the reactants? It might help to understand a simple physical reaction before we try more complicated chemical reactions.
Take the example of a ball on a hill. Does a ball at the top of a hill roll downhill spontaneously, or does the opposite happen? No one has ever seen a ball roll spontaneously uphill unless a lot of energy was added to the ball. This physical reaction appears to be irreversible, and occurs because the ball has lower potential energy at the bottom of the hill than it does at the top. The gap in the potential energy is related to the “extent” and spontaneity of this reaction. As we have observed before, nature tends to go to a lower energy state. By analogy, we will consider the driving force for a chemical reaction to be the free energy difference, ΔG, between the reactants and products. ΔG determines the extent and spontaneity of the reaction.
ANIMATION: BALL ON A HILL – WHAT YOU ALWAYS SEE!
ANIMATION: BALL ON A HILL – WHAT YOU NEVER SEE!
Reversible/Irreversible Reactions, Extent of Reactions, Equilibrium: Consider the hypothetical reversible reaction below, where A and B are the reactants and P and Q are the products:
A + B <–> P + Q
Imagine the scenario in which you start with reactants, A and B, each at a 1 M concentration (1 mol of each/L solution), but no products, P and Q. For ease assume that the total volume of solution is 1 L, so that we start with 1 mol each of A and B . At time t=0, the concentration of products is 0.
As time progresses, the amounts or concentrations of A and B decrease as the amounts or concentrations of products P and Q increase. At some time, no further changes occur in the amount or concentrations of remaining reactants or products. At this point the reaction is in equilibrium, a term used often in our common vocabulary to denote a system that is undergoing no net change.
Most of the reactions that we will study occur in solution, so we will deal with concentrations (in mol/L or mmol/mL = M). Lets consider how the concentration of reactants and products change as a function of time. Depending on the extent to which a reaction is reversible, 4 different scenarios can be imagined:
Scenario 1: Reversible Reaction in which forward and reverse reactions are equally favored.
In this type of reaction, as the [A] and [B] decrease, the [P] and [Q] increase, which increases the chance that P + Q will begin to collide and reform the reactants. Since P and Q can react equally in the reverse direction to from the reactants, A and B, the [A] and [B] at equilibrium will equal the [P] and [Q] when equilibrium is reached. This is denoted in the graph below, showing the [A] and [P] in the reaction over time. Reactions that are equally favored in this manner are rare in nature. It is more typical that unequal equilibrium will be established either in the direction of the reactants or the products, rather than producing a 50-50 mixture. These scenarios are listed in case 2 and 3 below.
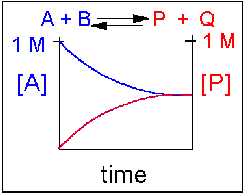
Figure 1.14 Reversible Reaction in Which the Reactants and Products are Equally Favored. In this reaction scenario, the reactant A, is equally as favored as the product P. Thus, as the reaction reaches equilibrium, the concentration of reactant A is equal to that of product P.
Reversible Reaction in which the reverse reaction is favored.
In this scenario, the [A] and the [B] decrease over time, while the [P] and the [Q] increase, note that only the [A] and [P] are shown in the graph below as an example. Since the reverse reaction between P and Q is favored over the reaction of A and B, the [A] and [B] is larger than that of [P] and [Q] when equilibrium is established.
An example of this kind of reaction, one that favors reactants, is the reaction of acetic acid (a weak acid) with water, where most of the acid remains in the protonated form.
CH3CO2H(aq) + H2O(l) <==> H3O+(aq) + CH3CO2–(aq)
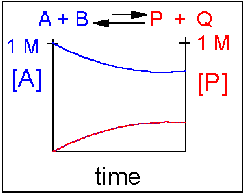
Figure 1.15 Reversible Reaction in Which the Reverse Reaction is Favored. In this reaction scenario, the formation of reactant A, is favored over the formation of the product P. Thus, as the reaction reaches equilibrium, the concentration of reactant A remains higher that of product P.
Reversible reaction in which the forward reaction is favored.
In this scenario, the [A] and the [B] decrease over time, while the [P] and the [Q] increase, note that only the [A] and [P] are shown in the graph below as an example. Since the forward reaction between A and B is favored over the reaction of P and Q, the [A] and the [B] is smaller than that of [P] and [Q] when equilibrium is established.
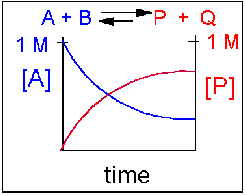
Figure 1.16 Reversible Reaction in Which the Forward Reaction is Favored. In this reaction scenario, the formation of product P, is favored over the formation of the reactant A. Thus, as the reaction reaches equilibrium, the concentration of reactant A is lower that of product P.
Irreversible reaction in which the reverse reaction occurs to a negligible extent.
In this reaction, the reverse reaction occurs to such a small extent that we can neglect it. The only reaction that occurs is the conversion of reactants to products. In essence, all the reactants are converted to products. In this model, at equilibrium the [A] and [B] will = 0. Since 1 mol of A and 1 mol of B reacted, it must form 1 mol of P and 1 mol Q – i.e. the concentration of products at equilibrium is 1 M. At an earlier time of the reaction, (let’s pick a time when [A] = 0.8 M), only part of the reactants have reacted (in this case 0.2 M), producing an equal amount of products, P and Q. Graphs of [A] and [P] as a function of time are shown below. [A] decreases in a nonlinear fashion to 0 M while [P] increases in a reciprocal fashion to 1 M concentration.
Examples of irreversible reactions are reactions of strong acids (nitric, sulfuric, hydrochloric) with bases (OH- and water), or combustion reactions like the burning of sugars (like trees) and hydrocarbons (like octane) to form CO2 and H2O.
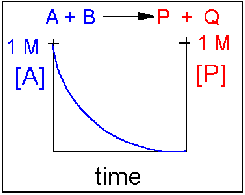
Figure 1.17 Irreversible Reaction in Which the Forward Reaction is Driven Towards Completion. In this reaction scenario, the formation of product P, is highly favored over the formation of the reactant A. Thus, as the reaction reaches equilibrium, the concentration of reactant A very close to zero, converting greater than 99% of the reactant into product P.
Equilibrium Constants
Without a lot of experience in chemistry, it is difficult to just look at the reactants and products and determine whether the reaction is irreversible, or reversible, favoring either reactants or products (with the exception of obvious irreversible reactions described above). However this data can be found in tables of equilibrium constants. The equilibrium constant (Keq), as its name implies, is constant and independent of the concentration of the reactants and products. A Keq > 1 implies that the products are favored. A Keq < 1 implies that reactants are favored. When Keq = 1, both reactants and products are equally favored. For the more general reaction,
where a, b, c, and d are the stoichiometric coefficients,
where all the concentrations are those at equilibrium. (Note: Equilibrium constants are truly constant only at a given temperature, pressure, and solvent condition. Likewise, they depend on concentration to the extent that their activities change with concentration.)
For a irreversible reaction, such as the reaction of a 0.1 M HCl(aq) in water, [HCl] at equilibrium approaches zero, so you can’t easily measure a Keq. However, if we assume the reaction goes in reverse to an almost imperceptible degree, [HCl]eq will be very, very small, such as 10-10 M. Hence Keq >> 1.
In summary, the extent of reactions can vary from completely irreversible (favoring only the products) to reactions that favor the reactants . Our next goal is to understand what controls the extent of a reaction. That is, of course, the change in the Gibbs free energy (ΔG). Two different pairs of factors influence the ΔG. One pair is concentration and inherent reactivity of reactants compared to products (as reflected in the Keq). The other pair is enthalpy/entropy changes. We will now consider the first pair .
Contributions of Molecule Stability (Keq) and concentration to ΔG
Consider the reactions of hydrochloric acid and acetic acid with water.
- HCl(aq) + H2O(l) –> H3O+(aq) + Cl–(aq)
- CH3CO2H(aq) + H2O(l) –> H3O+(aq) + CH3CO2–(aq)
Assume that at t = 0, each acid is placed into water at a concentration of 0.1 M. When equilibrium is reached, there is essentially no HCl left in solution, while 99% of the acetic acid remains. Why are they so different? We rationalized that HCl(aq) is a much stronger acid than H3O+(aq) which itself is a much stronger acid than CH3CO2H(aq). Why? All we can say is there is something about the structure of these acids (and the bases) that makes HCl much more intrinsically unstable, much higher in energy, and hence much more reactive than the acid it forms, H3O+(aq). Likewise, H3O+(aq) is much more intrinsically unstable, much higher in energy, and hence more reactive than CH3CO2H(aq). This has nothing to do with concentration, since the initial concentration of both HCl(aq) and CH3CO2H(aq) were identical. This observation is reflected in the Keq for these acids (>>1 for HCl and <<1 for acetic acid). This difference in intrinsic stability of reactants compared to products (which is independent of concentration) is one factor that contributes to ΔG.
The other factor is concentration. A 0.25 M (0.25 mol/L or 0.25 mmol/ml) solution of acetic acid does not conduct electricity, implying that very few ions of H3O+(aq) + CH3CO2–(aq) exist in solution. However, if more concentrated acetic acid is added, a dim light becomes evident. Adding more reactant seemed to drive the reaction to form more products, even though the reverse reaction is favored if one considers only the intrinsic stability of reactants and products. Before the concentrated acid was added, the system was at equilibrium. Adding concentrated acid perturbed the equilibrium, which drove the reaction to form additional products. This is an example of Le Chatelier’s Principle, which states that if a reaction at equilibrium is perturbed, the reaction will be driven in the direction that will relieve the perturbation. Hence:
- if more reactant is added, the reaction shifts to form more products
- if more product is added, the reaction shifts to form more reactants
- if products are selectively removed (by distillation, crystallization, or further reaction to produce another species), the reaction shifts to form more product.
- if reactants are removed (as above), the reaction shifts to form more reactants.
- if heat is added to an exothermic reaction, the reaction shifts to get rid of the excess heat by shifting to form more reactants. (opposite for an endothermic reaction).
Change in Free Energy G
For the reaction:
The total ΔG can be expressed as the sum of the two contributions showing the effects of the intrinsic stability (Keq) and concentration:
ΔG = ΔGstab + ΔGconc
ΔG = ΔGo + RTlnQrx
ΔGo reflects the contribution from the relative intrinsic stability of reactants and products, and RTlnQrx reflects the contribution from the relative concentrations of reactants and products (which has nothing to do with stability). Qrx is the reaction quotient which for the reaction A + B <=> P + Q is given by:
Thus, Qrx in the reaction above can be replaced to yield:
Remember that ΔG is the “driving” force for a reaction, analogous to the difference in potential energy (PE) for a ball on a hill. Go back to that analogy. if the ball starts at the top of the hill, does it roll down hill? Of course. It goes from high potential energy to low potential energy. The reaction can be written as: Ball top –> Ball bottom for which the change in potential energy, ΔPE = PEbottom -PEtop < 0. If the ball starts at the bottom, will it go to the top? Obviously not. For that reaction, Ball bottom –> Ball top, ΔPE > 0. If the top of the hill was at the same height at the bottom of the hill (obviously an absurd situation), the ball would not move. It would effectively be at equilibrium, a state of no change. For this reaction, Ball top –> Ball bottom, the ΔPE = 0. As the ball starts rolling down the hill, its potential energy gets closer to the potential it would have at the bottom. Hence the ΔPE changes from negative to more and more positive until it gets to the bottom at which case the ΔPE = 0 and movement ceases. If the ΔPE is not 0, the ball will move until the ΔPE = 0.
Likewise, for a chemical reaction that favors products, ΔG < 0. The system is not at equilibrium and the reaction will go in the direction of products. As the reaction proceeds, products build up, and there is less of a driving force for reactants to go to products (LeChatilier’s Principle), so the ΔG becomes more a more positive until the ΔG = 0 and the reaction is at equilibrium. A reaction that has a ΔG > 0 is likewise not at equilibrium so it will go in the appropriate direction until equilibrium is reached. Hence for the reaction A + B <==> P + Q,
- if ΔG < 0, the reaction goes toward products P and Q
- if ΔG = 0, the reaction is at equilibrium and no further change occurs in the concentration of reactants and products.
- if ΔG > 0, the reaction goes toward reactants A and B.
We can not measure easily the actual free energy G of reactants or products, but we can measure ΔG readily. These points are illustrated in the graph below of ΔG vs time for the hypothetical reaction A + B <==> P + Q. (Also notice the two insert graphs – in blue and red – which show, in analogy to the ball on the hill graphs, the values of ΔG at the two points where the perturbation to the equilibrium were made.)
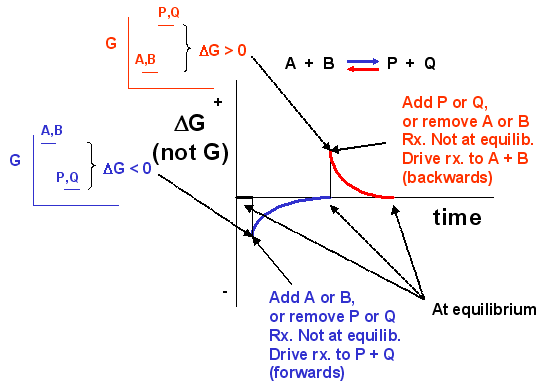
Figure 1.18 The Change in the Gibbs free energy (ΔG) is the Driving Force of the Reaction. In this diagram, equilibrium (where ΔG = 0) is represented by the black line of the horizontal axis. Using Le Chatlier’s Principle, it is possible to predict the behavior of a reaction when perturbations are made that shift the reaction out of equilibrium. For example, if more reactants (A or B) are added to the system or if products (P or Q) are removed from the system, the value of ΔG will shift and become < 0. This will drive the reaction into the forward direction (represented by the blue line and graphs) and return ΔG to 0, the equilibrium position. Conversely, if more products (P or Q) are added to the system, or if the reactants (A or B) are removed from the system the value of ΔG will shift and become > 0. This will drive the reaction into the reverse direction (represented by the red line and graphs) and return ΔG to 0, the equilibrium position.
Notice the ΔG is constantly changing until the system reaches equilibrium. Initially the equilibrium is perturbed so that the system is not in equilibrium (shown in blue). The perturbation was such that the products are favored. After equilibrium was reached, the system was perturbed again, this time in a fashion to favor the reverse reaction. Notice in this case the ΔG for the reaction as written: A + B <==> P + Q is positive – i.e. it is not in equilibrium. Therefore the reaction (as written) goes backwards to form the reactants, A and B.
Now let’s apply the equation to the two reactions we discussed above:
- HCl(aq) + H2O(l) <==>H3O+(aq) + Cl–(aq)
- CH3CO2H(aq) + H2O(l) <==> H3O+(aq) + CH3CO2–(aq)
Assume that at time t=0, 0.1 mole of HCl and CH3CO2H were added to two different beakers. At this point the forward reaction are favored, but obviously to different extents. The RTlnQrx would be identical for both acids, since each reactant is present at 0.1 M, but no products yet exist. However, the ΔGo is negative for HCl and positive for acetic acid since HCl is a strong acid. Hence at t=0, ΔG for the HCl reaction is much more negative than for acetic acid. This is summarized in table below. The direction of the arrow shows if products (–>) or reactants (<—) are favored. The size of the arrow shows very approximately to what extent the ΔG term is favored
Table 1.2 Comparison of Reactions at the Start of the Reaction (t = 0)
| Reaction at t=0 | ΔGo | RTlnQrx | ΔG |
| HCl(aq) + H2O(l) | —————> | —————> | —————————–> |
| CH3CO2H(aq) + H2O(l) | <————- | —————> | -> |
Now when equilibrium is reached, no net change occurs in the concentration of reactants and products, and ΔG = 0. In the case of HCl, there is just an infinitesimal amount of HCl left, and 0.1 M of each product, so concentration favors HCl formation. However, the intrinsic relative stability of reactants and products still favors products. In the case of acetic acid, most of the acetic acid remains (0.099 M) with little product (0.001 M) so concentration favors product. However, the intrinsic relative stability of reactants and products still favors reactants. This is summarized in table below.
Table 1.3 Comparison of Reactions at Equilibrium
| Reaction at equlib. | ΔGo stab | RTln Q | ΔG |
| HCl(aq) + H2O(l) | —————> | <————— | favors neither, = 0 |
| CH3CO2H(aq) + H2O(l) | <————- | ————–> | favors neither, = 0 |
Compare the two tables above (one at time t= 0 and the other at equilibrium). Notice:
- ΔGo does not change in a given set of condition, since it has nothing to do with concentration.
- Only RTlnQrx changes during the course of a reaction, until equilibrium is achieved.
The significance of ΔGo
To get a better meaning of the significance of ΔGo, let’s consider the following equation under two different conditions:
where
Condition I: Reaction at equilibrium, ΔG = 0
The equation can be reduced to solve for ΔGo
At equilibrium,
By substituting Keq, the equation can be further reduced to:
or further by converting the natural log into the log based 10 notation:
- This demonstrates that ΔGo is independent of concentration since Keq is also independent of concentration.
Condition II: Concentration of all reactants and products is 1 M (standard state, assuming solution reaction)
The equation can be reduced as follows:
This implies that when all reactants are at this concentration, defined as the standard state (1 M for solutes), the ΔG at that particular moment just happens to equal the ΔGo for the reaction. (However, if one of the reactants or products is H3O+, it would make little biological sense to calculate ΔGo for the reaction using the standard state of [H3O+] = 1 M, or a pH of -1. Instead, it is assumed that under biological conditions that the pH = 7, [H3O+] = 10-7 M for this specific condition).
When ΔG = ΔGo, a new symbol is used, ΔGo’. The ΔGo’(delta G naught prime) is defined as the free energy change of a reaction under standard conditions. Note that standard conditions also define temperature and pressure constraints for the system. The following are true for ΔGo’:
- all the reactants and products are at an initial concentration of 1.0 M
- Pressure is at 1.0 atm
- Temperature is at 25oC
Consider the reaction H + H –> H2. Does this reaction occur spontaneously? It does! You should remember that individual H atoms are unstable, since they don’t have an completed outer shell of electrons (in this case a duet). As they approach, they can interact to form a covalent bond and in the process release energy. The bonded state is a lower energy state than two separated H atoms. This should be clear since energy has to be added to a molecule of H2 to break the bond.
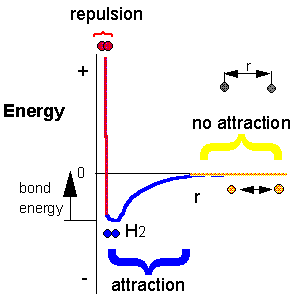
1.19 The Formation of New Bonds Releases Energy. Atoms bond together to form compounds because in doing so they attain lower energies than they possess as individual atoms, as indicated by the formation of the H2 molecule. A quantity of energy, equal to the difference between the energies of the bonded atoms (blue) and the energies of the separated atoms (red), is released, usually as heat. That is, the bonded atoms have a lower energy than the individual atoms do. When atoms combine to make a compound, energy is always given off, and the compound has a lower overall energy.
How about this reaction?
2C8H18(l) + 25O2(g) –> 16CO2(g) + 18H2O(g)
To carry out this reaction, every C-C, C-H and O-O bond in the reactants must be broken (which requires an input of energy) but a lots of energy is released during the formation of C-O and H-O covalent bonds in the products. Is more energy needed to break the bonds in the reactants or is more energy released on formation of bonds in the product? For this reaction the answer should be clear. The products must be at a lower energy than the reactants since huge amounts of heat and light energy are released on combustion of gasoline and other hydrocarbons.
These reactions suggest that energy must be released from a reaction for it to proceed to any extent in a given direction.
Now consider, however, the following reaction:
Ba(OH)2. 8H2O(s) + 2NH4SCN(s) –> 10H2O(l) + 2NH3(g) + Ba(SCN)2(aq+s)
When these two solids are mixed, and stirred, a reaction clearly takes places, as evidenced by the formation of a liquid (water) and the smell of ammonia. What is surprising is that heat is not released into the surroundings in this reaction. Rather heat was absorbed from the surroundings turning the beaker so cold that it freezes to a piece of wood (with a layer of water added to the wood) on which it was placed. This reaction seems to violate our idea that a reaction proceeds in a direction in which heat is liberated. Reactions which liberate heat and raise the temperature of the surroundings are called exothermic reactions. Reactions which absorb heat from the surroundings and hence lower the temperature of the surroundings are endothermic reactions. To answer the question we need to consider entropy.
The System, Surroundings, and the Universe: First and Second Laws of Thermodynamics
- First Law of Thermodynamics (Law of conservation of energy)– Energy cannot be created or destroyed in an isolated system.
- Second Law of Thermodynamics – the entropy of any isolated system always increases
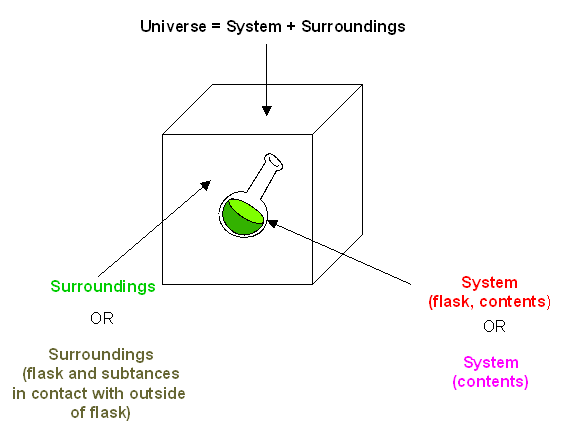
Figure 1.20 Representation of an Isolated System and Its Surroundings.
You may remember from General Chemistry that the change in the internal energy of a system, ΔE, is given by:
ΔEsys = q + w
where q is the heat (thermal energy). Thermal energy (q) will be (+) when transferred to the system, or (-) when transferred from the system. Work (w) is (+) when the work is done on the system or is (-) if work is done by the system. If only the pressure (P) and volume (V) determine the work that is done, then
w = – PextΔV
where Pext is the external pressure resisting a volume change in the system, ΔV. This term can be substituted in the equation above to yield:
ΔEsys = q – PextΔV
When pressure is constant, and only PV work is done, the equation can be rearranged to solve for q, which is now defined at qp to represent constant pressure.
qp = ΔEsys + PextΔV
where qp is the heat transferred at constant P (easily measured in a coffee cup calorimeter) which is equal to the change in enthalpy, ΔH, of the system. Therefore,
qp = ΔH
or
ΔH = ΔEsys + PextΔV
For exothermic reactions, the reactants have more thermal energy than the products, and the heat energy (measured in kilocalories) released is the difference between the energy of the products and reactants. When heat energy is used to measure the difference in energy, we call the energy enthalpy (H)and the heat released as the change inenthalpy (ΔH), as illustrated below.
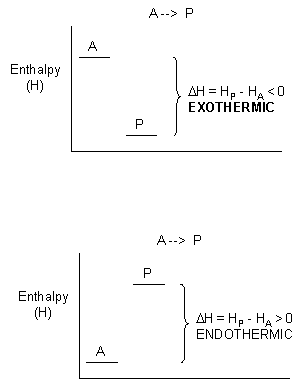
Figure 1.21 Change in Enthalpy (ΔH).ΔH is determined as the difference between the enthalpy of the products (HP) and the enthalpy of the reactants (HA). In exothermic reactions (ΔH) < 0 (upper graph) whereas in endothermic reactions (ΔH) > 0 (lower graph).
- For exothermic reactions, ΔH < 0
- For endothermic reactions, ΔH > 0
The equation
ΔEsys = q + w = q – PextΔV
is one expression of the First Law of Thermodynamics. Another statement of energy conservation, is:
ΔEtot = ΔEuniverse = ΔEsys + ΔEsurr = 0
Clearly, there must be something more that decides whether a reaction goes to a significant extent other that if heat is released from the system. That is, the spontaneity of a reaction must depend on more than just ΔHsys. Another example of a spontaneous natural reaction is the evaporation of water (a physical, not chemical process).
H2O (l) –> H2O (g)
Heat is absorbed from the surroundings to break the intermolecular forces (hydrogen bonds) among the water molecules (the system), allowing the liquid to be turned into a gas. If the surroundings are the skin, evaporation of water in the form of sweat cools the body. Why are these reactions spontaneous and essentially irreversible even though they are endothermic? Notice that in both of the endothermic reactions presented (the reactions of Ba(OH)2.8H2O(s) and 2NH4SCN(s) and the evaporation of water), the products are more disorganized (more disordered) than the products. A solid is more ordered than a liquid or gas, and a liquid is more ordered than a gas. In nature, ordered things become more disordered with time. Entropy (S), the other factor (in addition to enthalpy changes) is often considered to be a measure of the disorder of a system. The greater the entropy, the greater the disorder. For reactions that go from order (low S) to disorder (high S), the changed in S, ΔS > 0. For reaction that goes from low order to high order, ΔS < 0.
However, this common description of entropy is quite misleading. Macroscopic examples describing order/disordered states (such as the cleanliness of your room or the shuffling of a deck of card) are inappropriate since entropy deals with microscopic states.
The driving force for spontaneous reactions is the dispersion of energy and matter. Increases in entropy for reactions that involve matter occur when gases or solutes in solution are dispersed, leading to increases in positional entropy. For reactions involving energy changes, entropy increases when energy is dispersed as random, undirected thermal motion, leading to increases in thermal entropy. In this sense, entropy, S (a measure of (“spreadedness”) is a measure of number of different ways (microstates) that particles or energy can be arranged (W), not a measure of disorder! W is an abbreviation for the German word, Wahrscheinlichkeith, which means probability. It can be shown that for a solute dissolving in a solvent,
Wsys = Wsolute x Wsolvent
Note that this is a multiplicative function. Entropy is a logarithmic function of W which allows additivity of solute and solvent W values, a feature found in other thermodynamic state functions like ΔE, ΔH, and ΔS. Hence ln Wsys = ln Wsolute + ln Wsolvent. Boltzman showed that for molecules,
S = k ln W
where k is the Boltzman constant (1.68 x 10⁻²³ J/K), S units: J/K
or
S = kNA ln W = RlnW (J/K.mol)
for moles of molecules.
Boltzman realized the connection between the macroscopic entropy of a system and the microscopic order/disorder of a system through the equation S = klnW, Increasing S (macroscopic property) occurs with increasing numbers of possible microscopic states for the atoms and molecules of a system.
The dissolution of a solute in water and the expansion of a gas into a vacuum, both which proceed spontaneously toward an increase in matter dispersal, are examples of familiar processes characterized by a ΔSsys > 0.
The spontaneity of exothermic and endothermic processes will depend on the ΔStot = ΔSsurr + ΔSsys. ΔSsys often depends on matter dispersal (positional entropy). ΔSsurr depends on energy changes in the surroundings, ΔHsurr = -ΔHsys (thermal entropy).
It is more convenient to express thermodynamic properties based on the system which is being studied, not on the surrounding. This can be readily done for the ΔSsurr which depends both on ΔHsys and the temperature. First consider the dependency on ΔHsys. thermal energy flow into or out of the system, and since ΔHsys = – ΔHsurr,
ΔSsurr is proportional to -ΔHsys
- For an exothermic reaction, ΔSsurr > 0 (since ΔHsys < 0) and the reaction is favored;
- For an endothermic reaction, ΔSsurr < 0, (since ΔHsys > 0), and the reaction is disfavored;
ΔSsurr also depends on the temperature T of the surroundings:
ΔSsurr is proportional to 1/T
If the Tsurr is high, a given heat transfer to or from the surroundings will have a smaller effect on the ΔSsurr; conversely, if the Tsurr is low, the effect on ΔSsurr will be greater. (Atkins, in a recent General Chemistry, uses the analogy of the effect of a sneeze in library compared to in a crowded street; An American Chemistry General Chemistry text uses the analogy of giving $5 to a friend with $1000 compared to one who has just $10.) Hence,
ΔSsurr = -ΔHsys/T
(Note: from a more rigorous thermodynamic approach, entropy can be determined from dS = dqrev/T.)
ΔStot = ΔSsurr + Δ Ssys
ΔStot depends on both enthalpy changes in the system and entropy changes in the surroundings.
ΔStot = – ΔHsys/T + ΔSsys
Multiplying both sides by -T gives
-TΔStot = ΔHsys + TΔSsys
The thermodynamic function Gibb’s Free Energy, G, can be defined as: G = H – TS; At constant T and P,
ΔG = ΔH – TΔS
Hence
ΔGsys = ΔHsys – TΔSsys = – TΔStot
Spontaneity is determined by ΔStot OR ΔGsys since ΔStot = -ΔGsys/T . ΔGsys is widely use in discussing spontaneity since it is a state function, depends only on the enthalpy and entropy changes in the system, and is negative (as is the potential energy change for a falling object) for all spontaneous processes.
The second law of thermodynamics can be succinctly stated: For any spontaneous process, the ΔStot > 0. Unlike energy (from the First Law), entropy is not conserved.
back to the top
1.3 Chemical Foundations
The Importance of Water and Buffers
When it comes to water, we’re literally drowning in it, as water is by far the most abundant component of every cell. To understand life, we begin the discussion with the basics of water, because everything that happens in cells, even reactions buried deep inside enzymes, away from water, is influenced by water’s chemistry.
The water molecule has wide ‘V’ shape (the HO-H angle is 104°) with uneven sharing of electrons between the oxygen and the hydrogen atoms (Figure 7.14). Oxygen, with its higher electronegativity, holds electrons closer to itself than the hydrogens do. The hydrogens, as a result, are described as having a partial positive charge (typically designated as δ+) and the oxygen has a partial negative charge (written as δ- ). Thus, water is a polar molecule because charges are distributed around it unevenly, not symmetrically
1.22 Arrangement of Atoms in Water. Image by Aleia Kim
Water (Figure 1.22) is described as a solvent because of its ability to solvate (dissolve) many, but not all, molecules. Many molecules that are ionic or polar dissolve readily in water, but non-polar substances dissolve poorly in water, if at all. Oil, for example, which is non-polar, separates from water when mixed with it. On the other hand, sodium chloride, which ionizes, and ethanol, which is polar, are able to form hydrogen bonds, so both dissolve in water. Ethanol’s solubility in water is crucial for brewers, winemakers, and distillers – without this property, there would be no wine, beer or spirits. The term hydrophilic is used to describe substances that interact well with water and dissolve in it and the term hydrophobic to refer to materials that are non-polar and do not dissolve in water. Table 1.4 illustrates some polar and non-polar substances. A third term, amphiphilic, refers to compounds that have both properties. Soaps, for example are amphiphilic, containing a long, non-polar aliphatic tail and a head that ionizes.
Table 1.4 Hydrophilic vs Hydrophobic Compounds
Image by Aleia Kim
The solubility of materials in water is based in free energy changes, as measured by ΔG. Remember, from chemistry, that H is the enthalpy (heat at constant pressure) and S is entropy. Given this,
ΔG=ΔH−TΔS
where T is the temperature in Kelvin. For a process to be favorable, the ΔG for it must be less than zero. From the equation, lowered ΔG values will be favored with decreases in enthalpy and/or increases in entropy. Let us first consider why non-polar materials do not dissolve in water. We could imagine a situation where the process of dissolving involves the “surrounding” of each molecule of the nonpolar solute in water, just like each sodium and each chloride ion gets surrounded by water molecules as salt dissolves.
There is a significant difference, though between surrounding a non-polar molecule with water molecules and surrounding ions (or polar compounds) with water molecules.
The difference is that since non-polar molecules don’t really interact with water, the water behaves very differently than it does with ions or molecules that form hydrogen bonds. In fact, around each non-polar molecule, water gets very organized, aligning itself regularly. As any freshman chemistry student probably remembers, entropy is a measure of disorder, so when something becomes ordered, entropy decreases, meaning the ΔS is negative, so the TΔS term in the equation is positive (negative of a negative).
Since mixing a non-polar substance with water doesn’t generally have any significant heat component, the ΔG is positive. This means, then, that dissolving a non-polar compound in water is not favorable and does not occur to any significant extent. Further, when the non-polar material associates with itself and not water, then the water molecules are free to mix, without being ordered, resulting in an increase of entropy. Entropy therefore drives the separation of non-polar substances from aqueous solutions, as seen in Figure 1.23.
Figure 1.23 Vinegar (black) and oil (yellow) A mix of polar and nonpolar compounds Wikipedia
Next, we consider mixing of water with an amphiphilic substance, such as a soap, that has both polar and nonpolar regions within the molecule (Figure 1.24). The sodium ions attached to the fatty acids in soap readily come off in aqueous solution, leaving behind a negatively charged molecule at one end and a non-polar region at the other end. The ionization of the soap causes in an increase in entropy – two particles instead of one. The non-polar portion of the negatively charged soap ion is problematic – if exposed to water, it will cause water to organize and result in a decrease of entropy and create a positive ΔG.
Figure 1.24 – Structure of a Soap
Since we know fatty acids dissolve in water, there must be something else at play. There is. Just like the non-polar molecules in the first example associated with each other and not water, so too do the non-polar portions of the soap ions associate with each other and exclude water. The result is that the soap ions arrange themselves as micelles (Figure 1.25) with the non-polar portions on the interior of the structure away from water and the polar portions on the outside interacting with water.
Figure 1.25 – Structures formed by amphiphilic substances in water. Image by Aleia Kim
Figure 1.26 A phospholipid – an amphiphilic substance
The interaction of the polar heads with water returns the water to its more disordered state. This increase in disorder, or entropy, drives the formation of micelles. As will be seen in the discussion of the lipid bilayer, the same forces drive glycerophospholipids and sphingolipids to spontaneously form bilayers where the non-polar portions of the molecules interact with each other to exclude water and the polar portions arrange themselves on the outsides of the bilayer (Figure 1.27).
Figure 1.27 Environment of a lipid bilayer. Water is concentrated away from the hydrophobic center, being saturated on the outside, semi-saturated near the head-tail junction and fully dehydrated in the middle. Image by Aleia Kim
Yet another example is seen in the folding of globular proteins in the cytoplasm. Nonpolar amino acids are found in the interior portion of the protein (water excluded). Interaction of the non-polar amino acids turns out to be a driving force for the folding of proteins as they are being made in an aqueous solution (Figure 1.28).
Figure 1.28 Protein folding arranges hydrophobic amino acids (black dots) inside the protein
Hydrogen Bonds
The importance of hydrogen bonds in biochemistry (Figure 1.29) is hard to overstate. Linus Pauling himself said,
“ . . . . I believe that as the methods of structural chemistry are further applied to physiological problems it will be found that the significance of the hydrogen bond for physiology is greater than that of any other single structural feature.”
Figure 1.29 Common hydrogen bonds in biochemistry Image by Aleia Kim
Figure 1.30 Hydrogen bonds between water moleculesImage by Pehr Jacobson
In 2011, an IUPAC task group gave an evidence-based definition of hydrogen bonding that states,
“The hydrogen bond is an attractive interaction between a hydrogen atom from a molecule or a molecular fragment X–H in which X is more electronegative than H, and an atom or a group of atoms in the same or a different molecule, in which there is evidence of bond formation.”
The difference in electronegativity between hydrogen and the molecule to which it is covalently bound give rise to partial charges as described above. These tiny charges (δ+ and δ- ) result in formation of hydrogen bonds, which occur when the partial positive charge of a hydrogen atom is attracted to the partial negative of another molecule. In water, that means the hydrogen of one water molecule is attracted to the oxygen of another (Figure 1.30). Since water is an asymmetrical molecule, it means also that the charges are asymmetrical. Such an uneven distribution is what makes a dipole. Dipolar molecules are important for interactions with other dipolar molecules and for dissolving ionic substances (Figure 1.31).
Hydrogen bonds are not exclusive to water. In fact, they are important forces holding together macromolecules that include proteins and nucleic acids. Hydrogen bonds occur within and between macromolecules.
Figure 1.31 Example dipole interactions in biochemistry. Image by Aleia Kim
The complementary pairing that occurs between bases in opposite strands of DNA, for example, is based on hydrogen bonds. Each hydrogen bond is relatively weak (compared to a covalent bond, for example – Table 1.5), but collectively they can be quite strong.
Table 1.5 Bond Energies and Intermolecular Forces
Image by Aleia Kim
Their weakness, however, is actually quite beneficial for cells, particularly as regards nucleic acids (Figure 1.33). The strands of DNA, for example, must be separated over short stretches in the processes of replication and the synthesis of RNA. Since only a few base pairs at a time need to be separated, the energy required to do this is small and the enzymes involved in the processes can readily take them apart, as needed. Hydrogen bonds also play roles in binding of substrates to enzymes, catalysis, and protein-protein interaction, as well as other kinds of binding, such as protein-DNA, or antibody-antigen.
As noted, hydrogen bonds are weaker than covalent bonds (Table 1.5) and their strength varies form very weak (1-2 kJ/mol) to fairly strong (29 kJ/mol). Hydrogen bonds only occur over relatively short distances (2.2 to 4.0 Å). The farther apart the hydrogen bond distance is, the weaker the bond is.
The strength of the bond in kJ/mol represents the amount of heat that must be put into the system to break the bond – the larger the number, the greater the strength of the bond. Hydrogen bonds are readily broken using heat. The boiling of water, for example, requires breaking of H-bonds. When a biological structure, such as a protein or a DNA molecule, is stabilized by hydrogen bonds, breaking those bonds destabilizes the structure and can result in denaturation of the substance – loss of structure. It is partly for this reason that most proteins and all DNAs lose their native, or folded, structures when heated to boiling.
For DNA molecules, denaturation results in complete separation of the strands from each other. For most proteins, this means loss of their characteristic three-dimensional structure and with it, loss of the function they performed. Though a few proteins can readily reassume their original structure when the solution they are in is cooled, most can’t. This is one of the reasons that we cook our food. Proteins are essential for life, so denaturation of bacterial proteins results in death of any microorganisms contaminating the food.
Figure 1.32 Hydrogen bonds in a base pair of DNA
Image by Aleia Kim
The Importance of Buffers
A buffer is a solution that can resist pH change upon the addition of an acidic or basic components. It is able to neutralize small amounts of added acid or base, thus maintaining the pH of the solution relatively stable. This is important for processes and/or reactions which require specific and stable pH ranges. In biological systems, maintaining pH values is critical for maintaining life. The intracellular pH in most living cells is alkaline compared to the pH generated by protons that are transported passively through the plasma membrane by electrochemical forces. In addition to buffering systems such as the bicarbonate-carbonate system, protein-proton binding, and phosphoric acid, several membrane transporters are responsible for proton removal from the cytosol and play important roles in maintaining the alkaline pH in cells as shown in Figure 1.33. The normal physiological pH of mammalian arterial blood is strictly maintained at 7.40; A decrease of more than 0.05 units from the normal pH results in acidosis. Here we will examine how buffers work to maintain solution pH levels.

Figure 1.33 Proton Production in Living Tissues. Body fluid pH is strictly maintained by buffering systems, efflux across plasma membrane, and acid excretion.
Image from: Aoi, W. and Marunaka, Y. (2014) BioMed Res. Int. Article ID:59886
Water can ionize to a slight extent (10-7 M) to form H+ (proton) and OH– (hydroxide). We measure the proton concentration of a solution with pH, which is the negative log of the proton concentration.
pH = -Log[H+]
If the proton concentration, [H+]= 10-7 M, then the pH is 7. We could just as easily measure the hydroxide concentration with the pOH by the parallel equation,
pOH = -Log[OH– ]
In pure water, dissociation of a proton simultaneously creates a hydroxide, so the pOH of pure water is 7, as well. This also means that
pH + pOH = 14
Now, because protons and hydroxides can combine to form water, a large amount of one will cause there to be a small amount of the other. Why is this the case? In simple terms, if 0.1 moles of H+ is placed into a pure water solution, the high proton concentration will react with the relatively small amount of hydroxides to create water, thus reducing hydroxide concentration. Similarly, if excess hydroxide (as NaOH, for example) is placed into pure water, the proton concentration falls for the same reason.
Chemists use the term acid to refer to a substance which has protons that can dissociate (come off) when dissolved in water. They use the term base to refer to a substance that can absorb protons when dissolved in water. Both acids and bases come in strong and weak forms. (Examples of weak acids are shown in Table 1.6.) Strong acids, such as HCl, dissociate completely in water. If we add 0.1 moles (6.02×10²² molecules) of HCl to a solution to make a liter, it will have 0.1 moles of H+ and 0.1 moles of Cl- or 6.02×10²² molecules of each . There will be no remaining HCl when this happens. A strong base like NaOH also dissociates completely into Na+ and OH- .
Table 1.6 Examples of Weak Organic Acids
Image by Aleia Kim
Weak acids and bases differ from their strong counterparts. When you put one mole of acetic acid (HAc) into pure water, only a tiny percentage of the HAc molecules dissociate into H+ and Ac- . Clearly, weak acids are very different from strong acids. Weak bases behave similarly, except that they accept protons, rather than donate them. Since we can view everything as a form of a weak acid, we will not use the term weak base here.
Figure 1.34 Dissociation of a weak acid Image by Aleia Kim
Students are often puzzled and expect that [H+] = [A– ] because the dissociation equation shows one of each from HA. This is, in fact, true ONLY when HA is allowed to dissociate in pure water. Usually the HA is placed into solution that has protons and hydroxides to affect things. Those protons and /or hydroxides change the H+ and A concentration unequally, since A- can absorb some of the protons and/or HA can release H+ when influenced by the OH- in the solution. Therefore, one must calculate the proton concentration from the pH using the Henderson Hasselbalch equation.
pH = pKa + log ([Ac– ]/[HAc])
You may wonder why we care about weak acids. You may never have thought much of weak acids when you were in General Chemistry. Your instructor described them as buffers and you probably dutifully memorized the fact that “buffers are substances that resist change in pH” without really learning what this meant. Buffers are much too important to be thought of in this way.
Weak acids are critical for life because their affinity for protons causes them to behave like a UPS. We’re not referring to the UPS that is the United Parcel Service, but instead, to the encased battery backup systems for computers called Uninterruptible Power Supplies that kick on to keep a computer running during a power failure. The battery in a laptop computer is a UPS, for example.
We can think of weak acids as Uninterruptible Proton Suppliers within certain pH ranges, providing (or absorbing) protons as needed. Weak acids thus help to keep the H+ concentration (and thus the pH) of the solution they are in relatively constant.
Consider the bicarbonate/carbonic acid system. Figure 1.35 shows what happens when H2CO3 dissociates. Adding hydroxide ions (by adding a strong base like NaOH) to the solution causes the H+ ions to react with OH- ions to make water. Consequently, the concentration of H+ ions would go down and the pH would go up.
Figure 1.35 Titration curve for carbonic acid
Image by Aleia Kim
However, in contrast to the situation with a solution of pure water, there is a backup source of H+ available in the form of H2CO3. Here is where the UPS function kicks in. As protons are taken away by the added hydroxyl ions (making water), they are partly replaced by protons from the H2CO3. This is why a weak acid is a buffer. It resists changes in pH by releasing protons to compensate for those “used up” in reacting with the hydroxyl ions.
Henderson-Hasselbalch
It is useful to be able to predict the response of the H2CO3 system to changes in H+ concentration. The Henderson-Hasselbalch equation defines the relationship between pH and the ratio of HCO3 – and H2CO3. It is
pH = pKa + log ([HCO3– ]/ [H2CO3])
This simple equation defines the relationship between the pH of a solution and the ratio of HCO3– and H2CO3 in it. The new term, called the pKa, is defined as
pKa = -Log Ka,
just as
pH = -Log [H+]
The Ka is the acid dissociation constant and is a measure of the strength of an acid. For a general acid, HA, which dissociates as
HA ⇄ H+ + A –
then, Thus, the stronger the acid, the more protons that will dissociate from it when added to water and the larger the value its Ka will have. Large values of Ka translate to lower values of pKa.
- As a result, the lower the pKa value is for a given acid, the stronger the acid
Please note that pKa is a constant for a given acid. The pKa for carbonic acid is 6.37. By comparison, the pKa for formic acid is 3.75. Formic acid is therefore a stronger acid than carbonic acid. A stronger acid will have more protons dissociated at a given pH than a weaker acid.
Now, how does this translate into stabilizing pH? Figure 1.34 shows a titration curve. In this curve, the titration begins with the conditions at the lower left (very low pH). At this pH, the H2CO3 form predominates, but as more and more OH- is added the pH goes up, the amount of HCO3– goes up and (correspondingly), the amount of H2CO3 goes down. Notice that the curve “flattens” near the pKa (6.37).
Flattening of the curve tells us is that the pH is not changing much (not going up as fast) as it did earlier when the same amount of hydroxide was added. The system is resisting a change in pH (not stopping the change, but slowing it) in the region of about one pH unit above and one pH unit below the pKa. Thus, the buffering region of the carbonic acid/ bicarbonate buffer is from about 5.37 to 7.37. It is maximally strong at a pH of 6.37.
Now it starts to become apparent how the buffer works. HA can donate protons when extras are needed (such as when OH- is added to the solution by the addition of NaOH). Similarly, A- can accept protons when extra H+ are added to the solution (adding HCl, for example). The maximum ability to donate or accept protons comes when
[A– ] = [HA]
This is consistent with the Henderson Hasselbalch equation and the titration curve. When [A– ] = [HA], pH = 6.37 + Log(1). Since Log(1) = 0, pH = 6.37 = pKa for carbonic acid. Thus for any buffer, the buffer will have maximum strength and display flattening of its titration curve when [A– ] = [HA] and when pH = pKa. If a buffer has more than one pKa (Figure 1.36), then each pKa region will display the behavior.
Figure 1.36 Titration of an acidic amino acid
Image by Aleia Kim
To understand how well a buffer protects against changes in pH, consider the effect of adding .01 moles of HCl to 1.0 liter of pure water (no volume change) at pH 7, compared to adding it to 1.0 liter of a 1M acetate buffer at pH 4.76. Since HCl completely dissociates, in 0.01M (10-2 M) HCl you will have 0.01M H+. For the pure water, the pH drops from 7.0 down to 2.0 (pH = -log(0.01M)).
By contrast, the acetate buffer’s pH after adding the same amount of HCl is 4.74. Thus, the pure water solution sees its pH fall from 7 to 2 (5 pH units), whereas the buffered solution saw its pH drop from 4.76 to 4.74 (0.02 pH units). Clearly, the buffer minimizes the impact of the added protons compared to the pure water.
Buffer capacity
It is important to note that buffers have capacities limited by their concentration. Let’s imagine that in the previous paragraph, we had added the 0.01 moles HCl to an acetate buffer that had a concentration of 0.01M and equal amounts of Ac- and HAc. When we try to do the math in parallel to the previous calculation, we see that there are 0.01M protons, but only 0.005M A- to absorb them. We could imagine that 0.005M of the protons would be absorbed, but that would still leave 0.005M of protons unbuffered. Thus, the pH of this solution would be approximately
pH = -log(0.005M) = 2.30
Exceeding buffer capacity dropped the pH significantly compared to adding the same amount of protons to a 1M acetate buffer. Consequently, when considering buffers, it is important to recognize that their concentration sets their limits. Another limit is the pH range in which one hopes to control proton concentration.
Multiple ionizable groups
Now, what happens if a molecule has two (or more) ionizable groups? It turns out, not surprisingly, that each group will have its own pKa and, as a consequence, will have multiple regions of buffering. Figure 1.35 shows the titration curve for the amino acid aspartic acid. Note that instead of a single flattening of the curve, as was seen for acetic acid, aspartic acid’s titration curve displays three such regions. These are individual buffering regions, each centered on the respective pKa values for the carboxyl group and the amine group.
Aspartic acid has four possible charges: +1 (α-carboxyl group, α-amino group, and R-group carboxyl each has a proton), 0 (α- carboxyl group missing proton, α- amino group has a proton, R-group carboxyl has a proton), -1 (α-carboxyl group and R-group carboxyl each lack a proton, α-amino group retains a proton), -2 (α-carboxyl, R-group carboxyl, and α-amino groups all lack extra proton).
Prediction: How does one predict the charge for an amino acid at a given pH? A good rule of thumb for estimating charge is that if the pH is more than one unit below the pKa for a group (carboxyl or amino), the proton is on. If the pH is more than one unit above the pKa for the group, the proton is off. If the pH is NOT more than one or less than one pH unit from the pKa, this simple assumption will not work.
Further, it is important to recognize that these rules of thumb are estimates only. The pI (pH at which the charge of a molecule is zero) is an exact value calculated as the average of the two pKa values on either side of the zero region. It is calculated at the average of the two pKa values around the point where the charge of the molecule is zero. For aspartic acid, this corresponds to pKa1and pKa2.
back to the top
Organic Functional Groups
On the Earth, all carbon containing molecules have originated from biological, living organisms causing them to be termed organic compounds. The number of known organic compounds is a quite large. In fact, there are many times more organic compounds known than all the other (inorganic) compounds discovered so far, about 7 million organic compounds in total. Fortunately, organic chemicals consist of a relatively few similar parts, combined in different ways. These structural similarities allow us to predict how a compound we have never seen before may react, if we know how other molecules containing the same types of parts are known to react.
These parts of organic molecules are called functional groups and are made up from specific bonding patterns with the atoms most commonly found in organic molecules (C, H, O, N, S, and P). The identification of functional groups and the ability to predict reactivity based on functional group properties is one of the cornerstones of organic chemistry.
Functional groups are specific atoms, ions, or groups of atoms having consistent properties. A functional group makes up part of a larger molecule.
For example, -OH, the hydroxyl group that characterizes alcohols, is an oxygen with a hydrogen attached. It could be found on any number of different molecules.
Just as elements have distinctive properties, functional groups have characteristic chemistries. An -OH functional group on one molecule will tend to react similarly, although perhaps not identically, to an -OH on another molecule.
Organic reactions usually take place at the functional group, so learning about the reactivities of functional groups will prepare you to understand many other aspects about biochemistry.
Functional groups are structural units within organic compounds that are defined by specific bonding arrangements between specific atoms. The structure of capsaicin, the fiery compound found in hot peppers, incorporates several functional groups, labeled in the figure below and explained throughout this section.

As we progress in our study of biochemistry, it will become extremely important to be able to quickly recognize the most common functional groups, because they are the key structural elements that define how organic molecules react. Below is a brief introduction to the major organic functional groups.
Alkanes
The ‘default’ in organic chemistry (essentially, the lack of any functional groups) is given the term alkane, characterized by single bonds between carbon and carbon, or between carbon and hydrogen. Methane, CH4, is the natural gas you may burn in your furnace. Octane, C8H18, is a component of gasoline.
Alkenes and Alkynes
Alkenes (sometimes called olefins) have carbon-carbon double bonds, and alkynes have carbon-carbon triple bonds. Ethene, the simplest alkene example, is a gas that serves as a cellular signal in fruits to stimulate ripening. (If you want bananas to ripen quickly, put them in a paper bag along with an apple – the apple emits ethene gas (also called ethylene), setting off the ripening process in the bananas). Ethyne, commonly called acetylene, is used as a fuel in welding blow torches.

Many alkenes can take two geometric forms: cis or trans. The cis and trans forms of a given alkene are different isomers with different physical properties because there is a very high energy barrier to rotation about a double bond. In the example below, the difference between cis and trans alkenes is readily apparent.
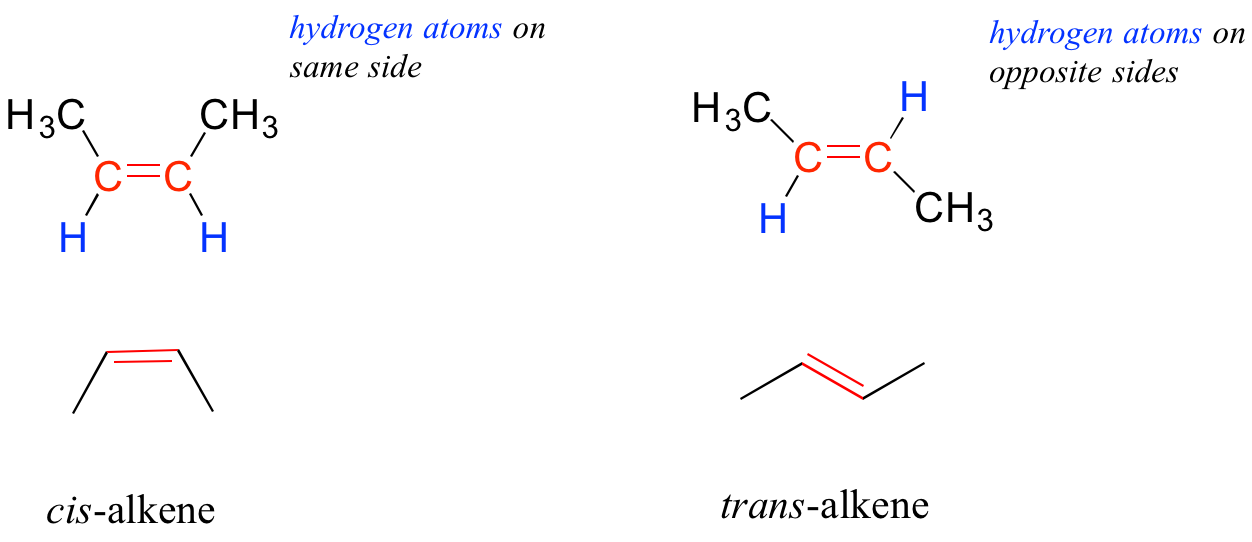
Alkanes, alkenes, and alkynes are all classified as hydrocarbons, because they are composed solely of carbon and hydrogen atoms. Alkanes are said to be saturated hydrocarbons, because the carbons are bonded to the maximum possible number of hydrogens – in other words, they are ‘saturated’ with hydrogen atoms. The double and triple-bonded carbons in alkenes and alkynes have fewer hydrogen atoms bonded to them – they are thus referred to as unsaturated hydrocarbons.
Aromatics
The aromatic group is exemplified by benzene (which used to be a commonly used solvent on the organic lab, but which was shown to be carcinogenic), and naphthalene, a compound with a distinctive ‘mothball’ smell. Aromatic groups are planar (flat) ring structures, and are widespread in nature.
Alkyl Halides
When the carbon of an alkane is bonded to one or more halogens, the group is referred to as an alkyl halide or haloalkane. Chloroform is a useful solvent in the laboratory, and was one of the earlier anesthetic drugs used in surgery. Chlorodifluoromethane was used as a refrigerant and in aerosol sprays until the late twentieth century, but its use was discontinued after it was found to have harmful effects on the ozone layer. Bromoethane is a simple alkyl halide often used in organic synthesis. Alkyl halides groups are quite rare in biomolecules.
Alcohols, Phenols, and Thiols
In the alcohol functional group, a carbon is single-bonded to an OH group (the OH group, when it is part of a larger molecule, is referred to as a hydroxyl group). Except for methanol, all alcohols can be classified as primary, secondary, or tertiary. In a primary alcohol, the carbon bonded to the OH group is also bonded to only one other carbon. In a secondary alcohol and tertiary alcohol, the carbon is bonded to two or three other carbons, respectively. When the hydroxyl group is directly attached to an aromatic ring, the resulting group is called a phenol. The sulfur analog of an alcohol is called a thiol (from the Greek thio, for sulfur).
Note that the definition of a phenol states that the hydroxyl oxygen must be directly attached to one of the carbons of the aromatic ring. The compound below, therefore, is not a phenol – it is a primary alcohol.

The distinction is important, because there is a significant difference in the reactivity of alcohols and phenols
Ethers and Sulfides
In an ether functional group, an oxygen is bonded to two carbons. Below is the structure of diethyl ether, a common laboratory solvent and also one of the first compounds to be used as an anesthetic during operations. The sulfur analog of an ether is called a thioether or sulfide.
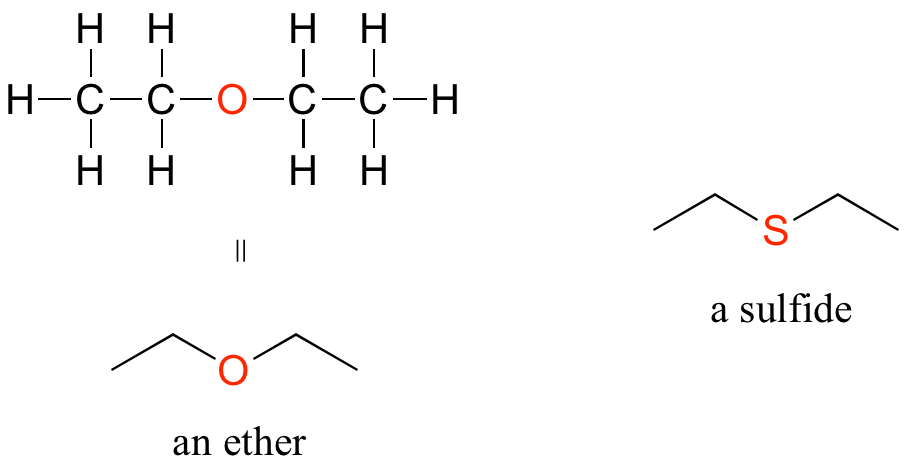
Amines
Amines are characterized by nitrogen atoms with single bonds to hydrogen and carbon. Just as there are primary, secondary, and tertiary alcohols, there are primary, secondary, and tertiary amines. Ammonia is a special case with no carbon atoms.
One of the most important properties of amines is that they are basic, and are readily protonated to form ammonium cations. In the case where a nitrogen has four bonds to carbon (which is somewhat unusual in biomolecules), it is called a quaternary ammonium ion.
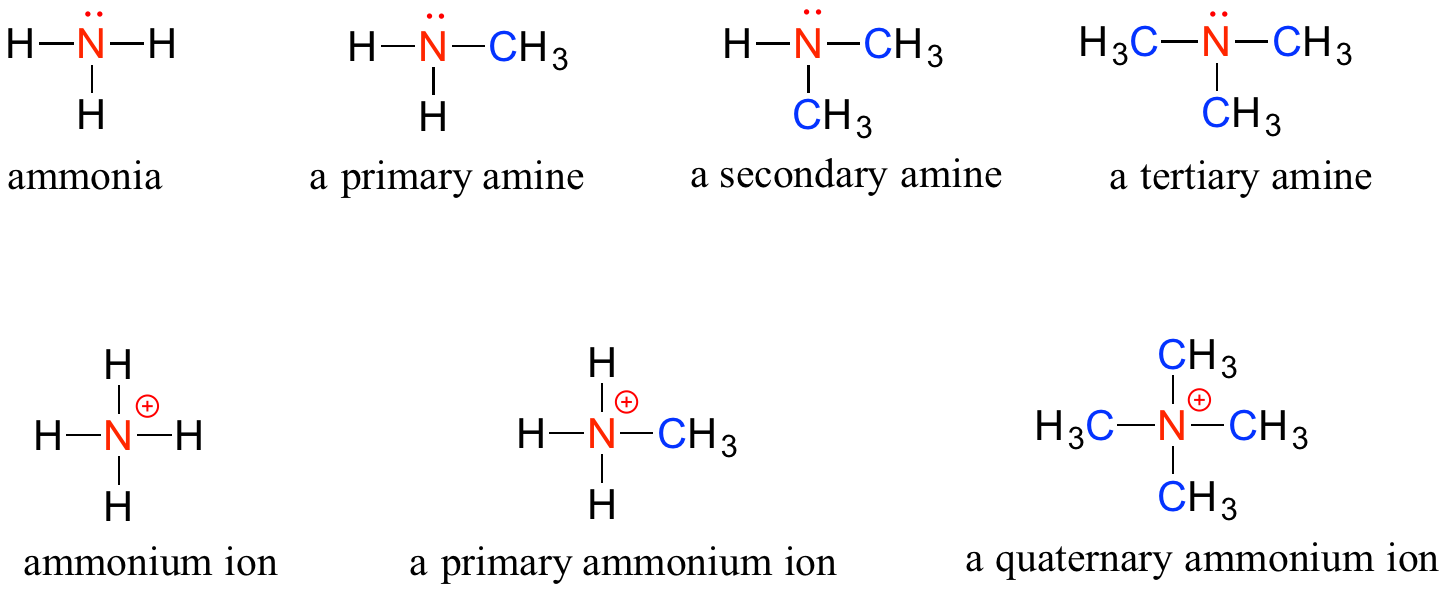
Note: Do not be confused by how the terms ‘primary’, ‘secondary’, and ‘tertiary’ are applied to alcohols and amines – the definitions are different. In alcohols, what matters is how many other carbons the alcohol carbon is bonded to, while in amines, what matters is how many carbons the nitrogen is bonded to.
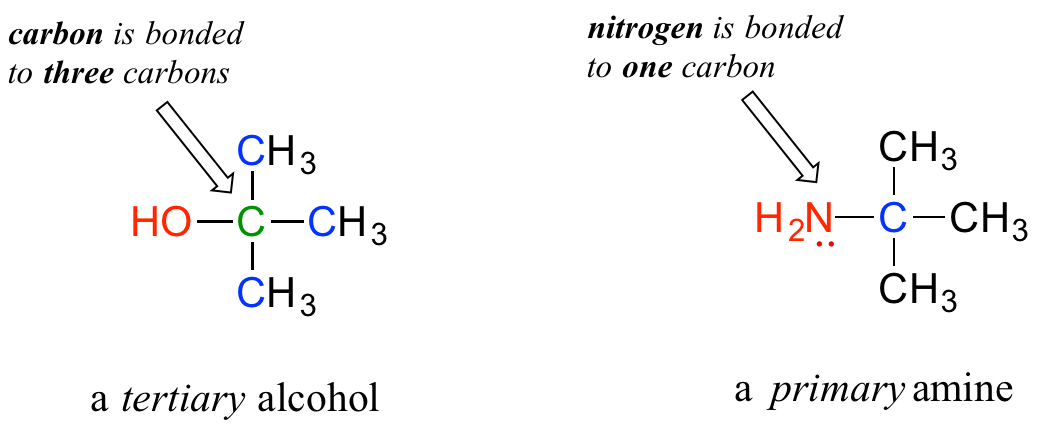
Organic Phosphates
Phosphate and its derivative functional groups are ubiquitous in biomolecules. Phosphate linked to a single organic group is called a phosphate ester; when it has two links to organic groups it is called a phosphate diester. A linkage between two phosphates creates a phosphate anhydride.

Aldehydes and Ketones
There are a number of functional groups that contain a carbon-oxygen double bond, which is commonly referred to as a carbonyl. Ketones and aldehydes are two closely related carbonyl-based functional groups that react in very similar ways. In a ketone, the carbon atom of a carbonyl is bonded to two other carbons. In an aldehyde, the carbonyl carbon is bonded on one side to a hydrogen, and on the other side to a carbon. The exception to this definition is formaldehyde, in which the carbonyl carbon has bonds to two hydrogens.

Carboxylic Acids and Their Derivatives
When a carbonyl carbon is bonded on one side to a carbon (or hydrogen) and on the other side to an oxygen, nitrogen, or sulfur, the functional group is considered to be one of the ‘carboxylic acid derivatives’, a designation that describes a set of related functional groups. The main member of this family is the carboxylic acid functional group, in which the carbonyl is bonded to a hydroxyl group. The carboxylate ion form has donated the H+ to the solution. Other derivatives are carboxylic esters(usually just called ‘esters’), thioesters, amides, acyl phosphates, acid chlorides, and acid anhydrides. With the exception of acid chlorides and acid anhydrides, the carboxylic acid derivatives are very common in biological molecules and/or metabolic pathways and will be discussed in further details in a later chapter.
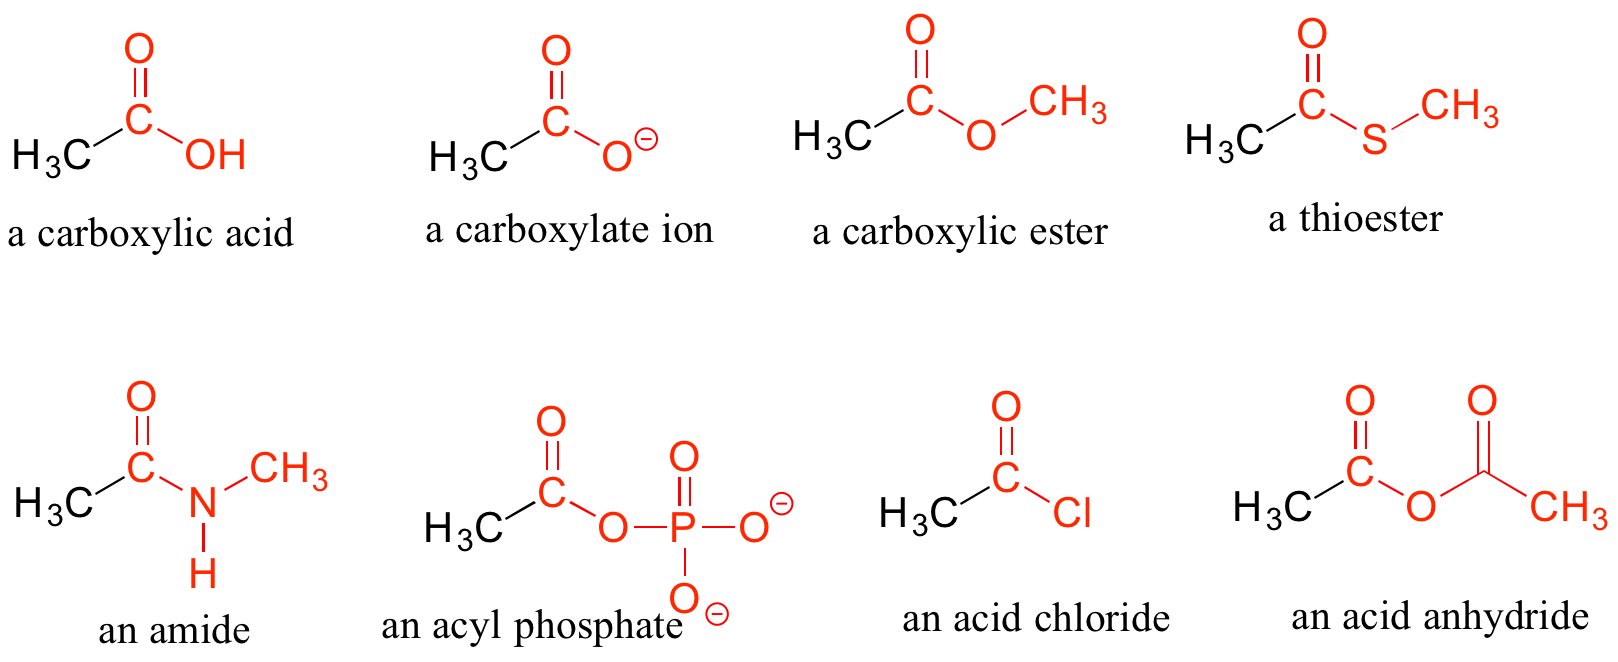
Practice Recognizing Functional Groups in Molecules
A single compound often contains several functional groups, particularly in biological organic chemistry. The six-carbon sugar molecules glucose and fructose, for example, contain aldehyde and ketone groups, respectively, and both contain five alcohol groups. A compound with several alcohol groups is often referred to as a ‘polyol’.

The hormone testosterone, the amino acid phenylalanine, and the glycolysis metabolite dihydroxyacetone phosphate all contain multiple functional groups, as labeled below.

While not in any way a complete list, this section has covered most of the important functional groups that we will encounter in biochemistry. Table 1.7 provides a summary of all of the groups listed in this section.
Table 1.7 Common Organic Functional Groups
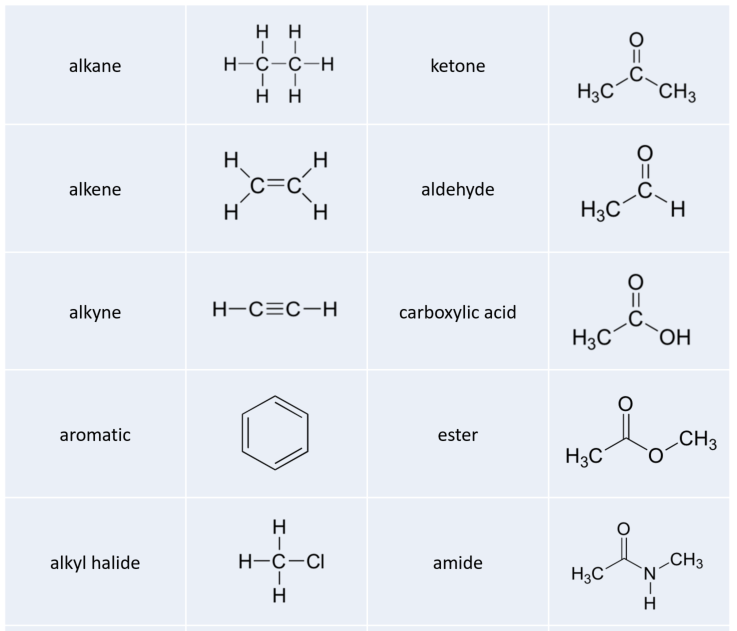
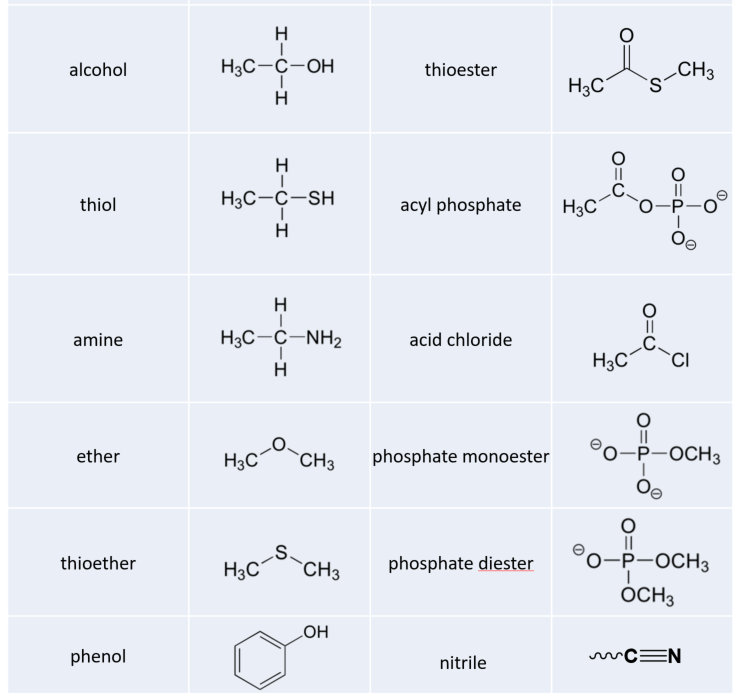
Exercise 1.1
Identify the functional groups (other than alkanes) in the following organic compounds. State whether alcohols and amines are primary, secondary, or tertiary.

Exercise 1.2
Draw one example each of compounds fitting the descriptions below, using line structures. Be sure to designate the location of all non-zero formal charges. All atoms should have complete octets (phosphorus may exceed the octet rule). There are many possible correct answers for these, so be sure to check your structures with your instructor or tutor.
a) a compound with molecular formula C6H11NO that includes alkene, secondary amine, and primary alcohol functional groups
b) an ion with molecular formula C3H5O6P2- that includes aldehyde, secondary alcohol, and phosphate functional groups.
c) A compound with molecular formula C6H9NO that has an amide functional group, and does not have an alkene group.
Primary Metabolites
Primary metabolites are components of basic metabolic pathways that are required for life. They are associated with essential cellular functions such as nutrient assimilation, energy production, and growth/development. They have a wide species distribution that span many phyla and frequently more than one kingdom. Primary metabolites include the building blocks required to make the four major macromolecules within the body: carbohydrates, lipids, proteins, and nucleic acids (DNA and RNA).
These are large polymers of the body that are built up from repeating smaller monomer units (Fig. 1.37). The monomer units for building the nucleic acids, DNA and RNA, are the nucleotide bases, whereas the monomers for proteins are amino acids, for carbohydrates are sugar residues, and for lipids are fatty acids or acetyl groups.
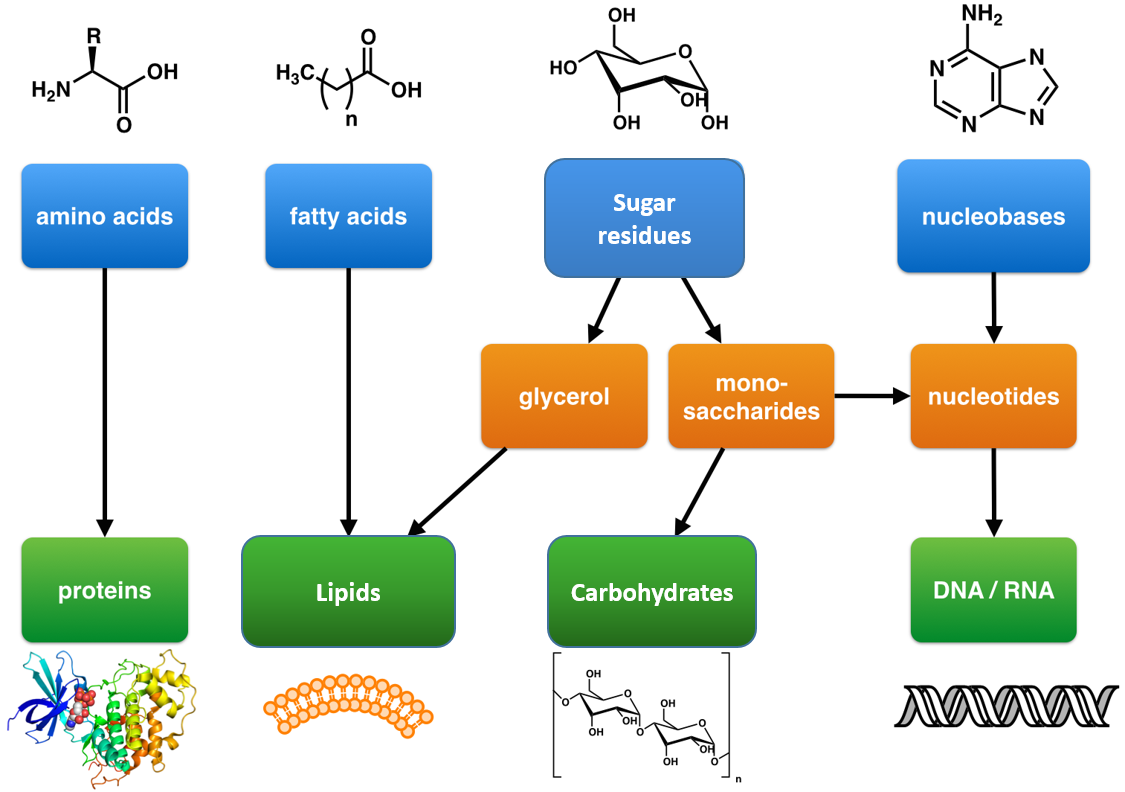
Figure 1.37 The Molecular building blocks of life are made from organic compounds. Modified from: Boghog
Reactions forming the Major Macromolecules
The major macromolecules are built by putting together repeating monomer subunits through the process of dehydration synthesis. Interestingly, the organic functional units used in the dehydration synthesis processes for each of the major types of macromolecules have similarities with one another. Thus, it is useful to look at the reactions together (Figure 1.38)
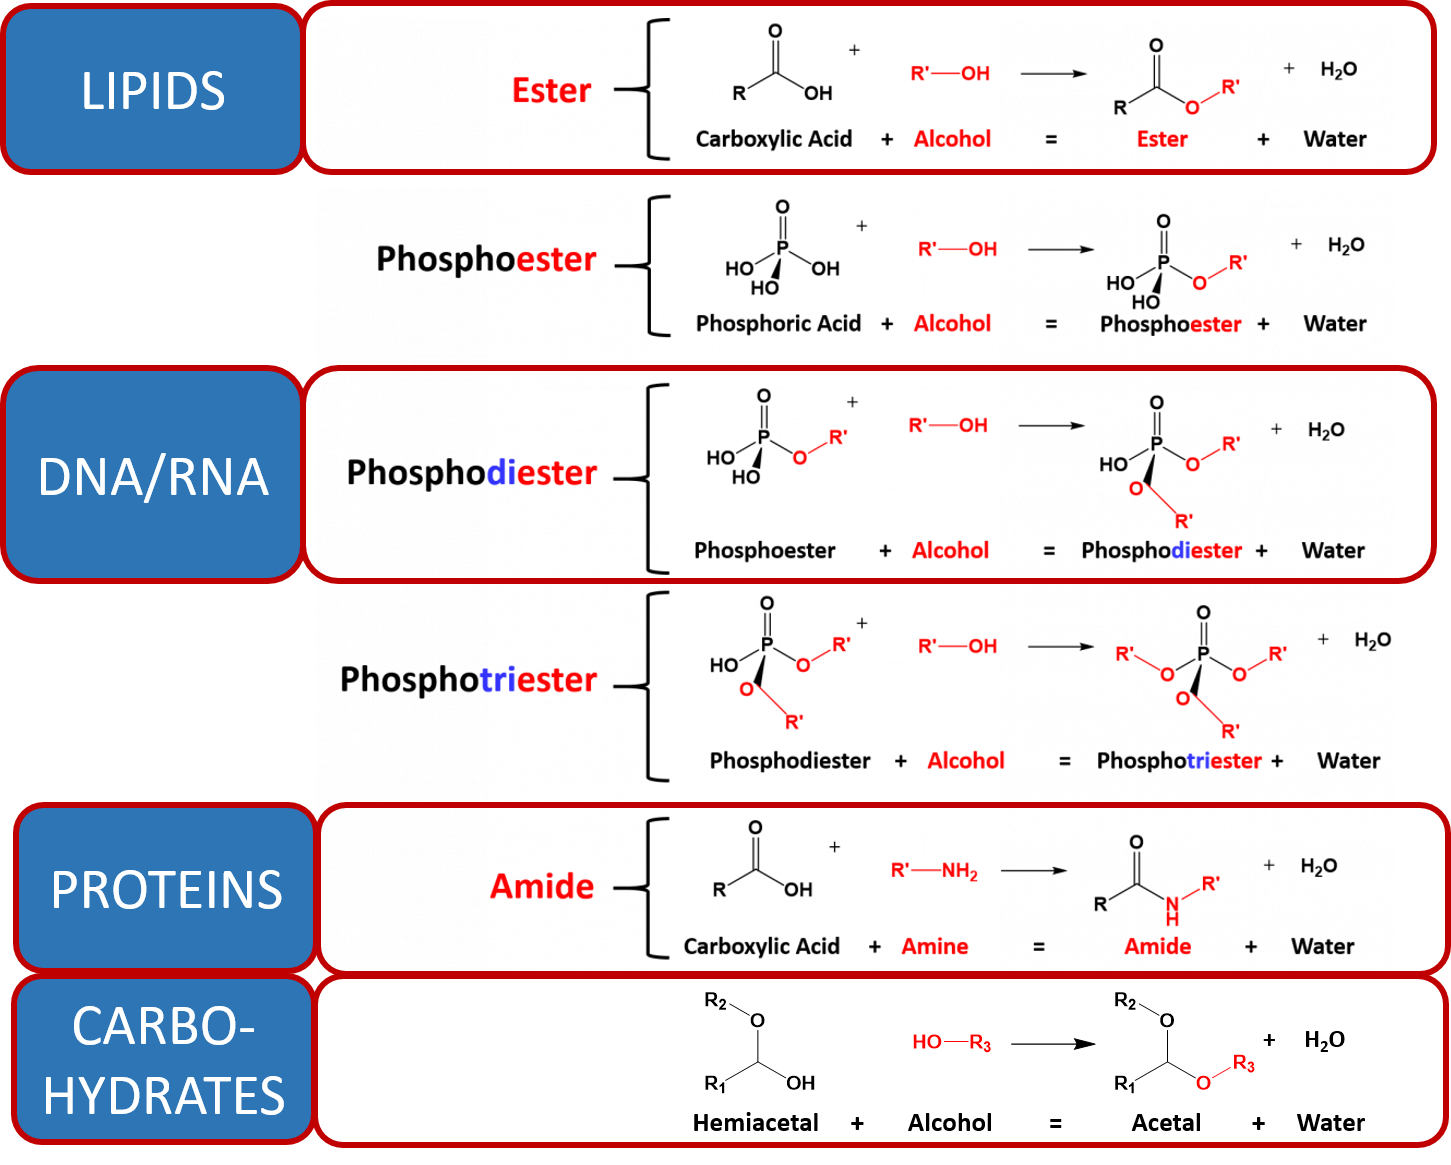
Figure 1.38 Dehydration Synthesis Reactions Involved in Macromolecule Formation. The major organic reactions required for the biosynthesis of lipids, nucleic acids (DNA/RNA), proteins, and carbohydrates are shown. Note that in all of the reactions, there is a functional group that contains two electron withdrawing groups (the carboxylic acid, phosphoric acid and the hemiacetal each have two oxygen atoms attached to a central carbon or phosphorus atom). This forms a reactive partially positive center atom (carbon in the case of the carboxylic acid and hemiacetal, or phosphorus in the case of the phosphoric acid) that can be attacked by the electronegative oxygen or nitrogen from an alcohol or amine functional group. Within biological systems, many functional groups, such as carboxylic acids, require activation before they can be utilized in synthesis reactions and will be detailed in later chapters.
Primary metabolites that are involved with energy production include numerous enzymes that breakdown food molecules, such as carbohydrates and lipids, and capture the energy released during the hydrolysis of adenosine triphosphate (ATP). Enzymes are biological catalysts that speed up the rate of chemical reactions. Typically they are proteins, which are composed of amino acid building blocks. The basic structure of cells and of organisms are also composed of primary metabolites. These include cell membranes (e.g. phospholipids), cell walls (e.g. peptidoglycan, chitin), and cytoskeletons (proteins). DNA and RNA which store and transmit genetic information are composed of nucleic acid primary metabolites. Primary metabolites also include molecules involved in cellular signaling, communication and transport. The structure and function of primary metabolites are a key component of this text. These reactions will be detailed in the following chapters.
back to the top
1.4 Genetic, Epigenetic, and Evolutionary Foundations
The development of complex biological organisms on our planet has arisen through the evolutionary mechanism of natural selection. The British naturalist, Charles Darwin proposed the theory of biological evolution by natural selection in his book, ‘On the Origins of Species’ that was published in 1859. Darwin defined evolution as “descent with modification,” the idea that species change over time, give rise to new species, and share a common ancestor. The mechanism that Darwin proposed for evolution is natural selection. Because resources are limited in nature, organisms with heritable traits that favor survival and reproduction will tend to leave more offspring than their peers, causing the traits to increase in frequency within a population over generations. Thus, natural selection causes populations to become adapted, or increasingly well-suited, to their environments over time. Natural selection depends on the environment and requires existing heritable variation in a group.
Natural selection acts on an organism’s phenotype, or physical characteristics. Phenotype is determined by an organism’s genetic make-up (genotype) and the environment in which the organism lives. When different organisms in a population possess different versions of a gene for a certain trait, each of these versions is known as an allele. It is primarily this genetic variation that underlies differences in phenotype. Some traits are governed by only a single gene, but most traits are influenced by the interactions of many genes. A variation in one of the many genes that contributes to a trait may have only a small effect on the phenotype; together, these genes can produce a continuum of possible phenotypic values.
For example, interactions between different equine coat color genes determine a horse’s coat color. Many colors are possible, but all variations are produced by changes in only a few genes. Extension and agouti are particularily well-known genes with dramatic effects. For example, differences at the agouti gene can help determine whether a horse is bay or black in coloration, and a change to the extension gene can in turn make a horse chestnut colored instead (Figure 1.39). Yet other gene variants are responsible for the myriad of other coat color possibilities, including palomino, buckskin, and cremello horses.
Figure 1.39 Genotype Variations as Determinants of Horse Coat Color. Horses that are capable of producing the black pigment, eumelanin, have at least one copy of the dominant extension gene (E/E or E/e). Interestingly, the agouti gene controls the restriction of true black pigment (eumelanin) in the coat. Horses expressing an extension dominant gene, and are recessive at the agouti gene locus (a/a) will be black in color, as shown in (a). Whereas horses that are dominant for extension (E/E or E/a) but are also dominant for the agouti genotype (A/A or A/a), will never be fully black. Depending on other gene loci, they will instead show coloration patterns such as bay, as shown in (b). Image (a) provided by: Serendipityblue; Image (b) provided by: CMSporthorses
Thus, the primary molecular mechanism that drives natural selection is controlled by the heretability and mutability of genetic traits housed in the major macromolecule, deoxyribonucleic acid (DNA). In chapter 4, you will learn about the structural characteristics of DNA, whereas chapter 9 focuses on the biochemical mechanisms involved with DNA replication and also details the importance of DNA repair process and molecular mechanisms of evolution at the genetic level.
Notably, the phenotypic traits determined by the genetic make-up of an organism are not controlled directly by the genetic material, DNA, but by the proteins that are produced from the information housed within the gene. In 1945, geneticist George Beadle proposed the one gene-one enzyme hypothesis suggesting that genes are highly specific when they encode for a protein sequence. However, it would take 16 more years before the biochemical nature of this process was deduced. Efforts to understand how proteins are encoded began after DNA’s structure was discovered in 1953. George Gamow postulated that sets of three bases must be employed to encode the 20 standard amino acids used by living cells to build proteins, which would allow a maximum of 43 = 64 amino acids.
The Crick, Brenner, Barnett and Watts-Tobin experiment first demonstrated that codons consist of three DNA bases (Figure 1.40). Marshall Nirenberg and Heinrich J. Matthaei were the first to reveal the nature of a codon in 1961.
Figure 1.40 Codons Consist of Sets of Three Bases. A series of codons in part of a messenger RNA (mRNA) molecule. Each codon consists of three nucleotides, usually corresponding to a single amino acid. The nucleotides are abbreviated with the letters A, U, G, C. This is mRNA which uses U (uracil). DNA uses T (thymine) instead. This mRNA molecule will instruct a ribosome to synthesize a protein according to this code.
Image by Sverdrup
They used a cell-free system to translate a poly-uracil RNA sequence (i.e., UUUUU…) and discovered that the polypeptide that they had synthesized consisted of only the amino acid phenylalanine. They thereby deduced that the codon UUU specified the amino acid phenylalanine.
This was followed by experiments in Severo Ochoa‘s laboratory that demonstrated that the poly-adenine RNA sequence (AAAAA…) coded for the polypeptide poly-lysine and that the poly-cytosine RNA sequence (CCCCC…) coded for the polypeptide poly-proline. Therefore, the codon AAA specified the amino acid lysine, and the codon CCC specified the amino acid proline. Using various copolymers most of the remaining codons were then determined.
Subsequent work by Har Gobind Khorana identified the rest of the genetic code. Shortly thereafter, Robert W. Holley determined the structure of transfer RNA (tRNA), the adapter molecule that facilitates the process of translating RNA into protein. This work was based upon Ochoa’s earlier studies, yielding the latter the Nobel Prize in Physiology or Medicine in 1959 for work on the enzymology of RNA synthesis.
Extending this work, Nirenberg and Philip Leder revealed the code’s triplet nature and deciphered its codons (Figure 1.41). In these experiments, various combinations of mRNA were passed through a filter that contained ribosomes, the components of cells that translate RNA into protein. Unique triplets promoted the binding of specific tRNAs to the ribosome. Leder and Nirenberg were able to determine the sequences of 54 out of 64 codons in their experiments. Khorana, Holley and Nirenberg received the 1968 Nobel for their work.
The three stop codons were named by discoverers Richard Epstein and Charles Steinberg. “Amber” was named after their friend Harris Bernstein, whose last name means “amber” in German. The other two stop codons were named “ochre” and “opal” in order to keep the “color names” theme.
Figure 1.41 The Genetic Code. Image edited by Seth Miller, Original file designed and produced by: Kosi Gramatikoff courtesy of Abgent
Each gene contains a reading frame is defined by the initial triplet of nucleotides from which translation starts. It sets the frame for a run of successive, non-overlapping codons, which is known as an open reading frame (ORF). For example, the string 5′-AAATGAACG-3′, if read from the first position, contains the codons AAA, TGA, and ACG ; if read from the second position, it contains the codons AAT and GAA ; and if read from the third position, it contains the codons ATG and AAC. Every sequence can, thus, be read in its 5′ → 3′ direction in three reading frames, each producing a possibly distinct amino acid sequence: in the given example, Lys (K)-Trp (W)-Thr (T), Asn (N)-Glu (E), or Met (M)-Asn (N), respectively. When DNA is double-stranded, six possible reading frames are defined, three in the forward orientation on one strand and three reverse on the opposite strand. Protein-coding frames are defined by a start codon, usually the first AUG (ATG) codon in the RNA (DNA) sequence.
To terminate the translation process, there are three stop codons have names: UAG is amber, UGA is opal (sometimes also called umber), and UAA is ochre. Stop codons are also called “termination” or “nonsense” codons. They signal release of the nascent polypeptide from the ribosome.
During the process of DNA replication, errors occasionally occur in the polymerization of the second strand. These errors, mutations, can affect an organism’s phenotype, especially if they occur within the protein coding sequence of a gene. Error rates are typically 1 error in every 10–100 million bases—due to the “proofreading” ability of DNA polymerases.
Missense mutations and nonsense mutations are examples of point mutations that can cause genetic diseases such as sickle-cell disease and thalassemia respectively. Clinically important missense mutations generally change the properties of the coded amino acid residue among basic, acidic, polar or non-polar states, whereas nonsense mutations result in a stop codon.
Mutations that disrupt the reading frame sequence by indels (insertions or deletions) of a non-multiple of 3 nucleotide bases are known as frameshift mutations. These mutations usually result in a completely different translation from the original, and likely cause a stop codon to be read, which truncates the protein. These mutations may impair the protein’s function and are thus rare in in vivo protein-coding sequences. One reason inheritance of frameshift mutations is rare is that, if the protein being translated is essential for growth under the selective pressures the organism faces, absence of a functional protein may cause death before the organism becomes viable. Frameshift mutations may result in severe genetic diseases such as Tay–Sachs disease.
Although most mutations that change protein sequences are harmful or neutral, some mutations have benefits. These mutations may enable the mutant organism to withstand particular environmental stresses better than wild type organisms, or reproduce more quickly. In these cases a mutation will tend to become more common in a population through natural selection. Different sequence variations of the same gene or protein within a single organism, within a population, or between different species are known as sequence polymorphisms. Larger scale gene duplication events can also lead to evolutionary events.
The evolution of proteins is studied by comparing the sequences and structures of proteins from many organisms representing distinct evolutionary clades. If the sequences/structures of two proteins are similar indicating that the proteins diverged from a common origin, these proteins are called homologous proteins. More specifically, homologous proteins that exist in two distinct species are called as orthologs. Whereas, homologous proteins encoded by the genome of a single species are called paralogs. Unrelated genes that have separate evolutionary origins, but that each encode proteins that have similar functions are termed analogs (Figure 1.42).
Figure 1.42 Genetic Evolution of Protein Sequences. (Upper Panel) An ancestral gene dupliates to produce two paralogs (Gene A and B). A speciation event produces orthologs in the two daughter species. In a separate species, an unrelated gene has a similar function (Gene C) but has a separate evolutionary origin and so is an analog. (Lower Panel) 3-D protein models were retrieved or modeled using SWISS-MODEL: Human Histone H1.1 (Q02539), Human Histone H1.2 (P16403), E. coli HNS (P0ACF8). Histone H1.1 from the chimpanzee (Pan troglodytes XP_016810512.1) was modeled using Human Histone H1.1 as a template. Note that the E. coli HNS protein is typically modeled as a dimer. Only a single monomer is shown here.
Upper Image by Thomas Shafee
DNA sequencing techniques have rapidly improved over the last 15 to 20 years making it possible to sequence the entire genomes of organisms and thus, predict the entire proteome of an organism, based on the translation of the sequenced genome followed by the annotation of predicted ORFs using phylogenetic comparison of similar genes/proteins from other known organisms. This has given rise to the field of Bioinformatics which uses computer science, mathematics and statistical analysis to analyze the large quantities of biological data created in genome sequencing projects. The phylogenetic relationships, and hence ancestral relationships, of various genes, proteins, and ultimately organisms can be established through the statistical analysis of sequence alignments. Such phylogenetic trees have established that the sequence similarities among proteins reflect closely the evolutionary relationships among organisms.
Protein evolution describes the changes over time in protein shape, function, and composition. Through quantitative analysis and experimentation, scientists have strived to understand the rate and causes of protein evolution. Using the amino acid sequences of hemoglobin and cytochrome c from multiple species, scientists were able to derive estimations of protein evolution rates. What they found was that the rates were not the same among proteins. Each protein has its own rate, and that rate is constant across phylogenies (i.e., hemoglobin does not evolve at the same rate as cytochrome c, but hemoglobins from humans, mice, etc. do have comparable rates of evolution.). Not all regions within a protein mutate at the same rate; functionally important areas mutate more slowly and amino acid substitutions involving similar amino acids occurs more often than dissimilar substitutions. Overall, the level of polymorphisms in proteins seems to be fairly constant. Several species (including humans, fruit flies, and mice) have similar levels of protein polymorphism.
Gene duplication events followed by mutation can also give rise to paralogs with unique and different functions within an organism. This can make the annotation of genomes based on sequence alone a difficult task, as homologous protein sequences may not have similar functions in vivo. It is estimated that approximately 10-25% of annotations made on sequence homology are incorrect and require experimental validation. For example human pancreatic ribonuclease is a digestive enzyme utilized to breakdown nucleic acids. The angiogenin protein is a paralog of pancreatic ribonuclease and shares high sequence homology and 3-D shape (Figure 1.43). However, the functions of these proteins are quite different. Angiogenin induces vascularization by activating transcriptional processes in endothelial cells. However, if the function of only one of these homologs was known, it would be easy to mistakenly hypothesize that the homologous protein would be similar in function. Thus, care must be taken when using bioinformatic tools to not overestimate the predictive ability of sequence alignments.
Figure 1.43 Homologous Proteins Do Not Always Have Homologous Functions. In the example above, the digestive enzyme, pancreatic ribonuclease is a paralog of the angiogenin protein and shares an ancestral origin. However, the functions of each of these proteins are quite divergent and have evolved such that they do not share homologous function. 3-D protein models were retrieved using SWISS-MODEL: Human Pancreatic Ribonuclease (P07998) and Human Angiogenin (P03950)
The control of gene expression is critical in all processes of life, allowing for the differentiation of cells to form different body structures and organs, as well as smaller more reversible changes that allow an organism to respond to different environmental situations and stimuli. In chapter 12, you will explore the major biochemical mechanisms used to control gene expression within cells. This will include the discussion of a fairly new and exciting field of study known as epigenetics. In addition to the heritibility of traits through the passage of genetic information, it is fast becoming clear that the environmental factors that an organism is exposed to throughout its life can effect gene expression without physically altering the DNA sequence, and that these changes in expression patterns can be long-lasting and can even be inherited in the following generations. The term epigenetics literally means ‘on top of’ or ‘in addition to’ genetics and focuses on the heritible gene expression patterns that are induced by the exposure or experience of an organism within its environment.
For example in human populations, stressful events such as starvation can have lasting imprints in children that are born under these conditions. These children have higher risks of obesity and metabolic disorders as adults, including the development of type II diabetes. In fact, these predispositions can be carried not only to the children born during the starvation event, but also to their future children indicating that environmental events can effect gene expression patterns through multiple generations. In more controlled laboratory experiments using rats, it has been demonstrated that the more a mother rat licks and nutures its offspring, the calmer and more relaxed the offspring will be as an adult. Mother rats that are less nurturing and ignore their young, have offspring that will grow up displaying higher levels of anxiety. These changes are not caused by genetic differences between the offspring, but rather by differences in gene expression patterns. In fact, calm and relaxed mice can be altered to show high anxiety by exposing them to agents that alter gene expression patterns. Mechanisms controlling such heritible alterations in gene expression patterns will be covered in chapter xx.
back to the top
1.5 References
- Jakubowski, H. (2017) Biochemistry Online: An Approach Based on Chemical Logic. Retrieved from: http://employees.csbsju.edu/hjakubowski/classes/ch331/bcintro/default.html
- Ahern, K. and Rajagopal, I. () Cells, Water, and Buffers. Chapter in the Online Textbook: Biochemistry Free and Easy, Published on Libretexts through Oregon State University. Retrieved on July 8th, 2019 from: https://bio.libretexts.org/Bookshelves/Biochemistry/Book%3A_Biochemistry_Free_and_Easy_(Ahern_and_Rajagopal)
- Wikipedia contributors. (2020, April 15). Nucleoporin. In Wikipedia, The Free Encyclopedia. Retrieved 16:42, April 19, 2020, from https://en.wikipedia.org/w/index.php?title=Nucleoporin&oldid=951100189
- Wikibooks. (2015) Organic Chemistry. Available at: https://en.wikibooks.org/wiki/Organic_Chemistry.
- Clark, J. (2014) How to Draw Organic Molecules. Available at: http://chem.libretexts.org/Core/Organic_Chemistry/Fundamentals/How_to_Draw_Organic_Molecules
- Soderberg, T. (2016). Organic Chemistry With a Biological Emphasis . Published under Creative Commons by-nc-sa 3.0.
- Anonymous. (2012) Introduction to Chemistry: General, Organic, and Biological (V1.0). Published under Creative Commons by-nc-sa 3.0. Available at: http://2012books.lardbucket.org/books/introduction-to-chemistry-general-organic-and-biological/index.html
- Organic Chemistry Portal. WikiUniversity. Available at: https://en.wikiversity.org/wiki/Portal:Organic_chemistry
- Anonymous. (2012) Introduction to Chemistry: General, Organic, and Biological (V1.0). Published under Creative Commons by-nc-sa 3.0. Available at: http://2012books.lardbucket.org/books/introduction-to-chemistry-general-organic-and-biological/index.html
- Kahn Academy (2019) Darwin, Evolution and Natural Selection. Retrieved on July 3rd, 2019 from: https://www.khanacademy.org/science/biology/her/evolution-and-natural-selection/a/darwin-evolution-natural-selection
- Wikipedia contributors. (2019, June 17). Natural selection. In Wikipedia, The Free Encyclopedia. Retrieved 17:40, July 3, 2019, from https://en.wikipedia.org/w/index.php?title=Natural_selection&oldid=902211644
- Wikipedia contributors. (2019, June 24). Equine coat color genetics. In Wikipedia, The Free Encyclopedia. Retrieved 18:17, July 3, 2019, from https://en.wikipedia.org/w/index.php?title=Equine_coat_color_genetics&oldid=903277782
- Wikipedia contributors. (2019, June 27). Sequence homology. In Wikipedia, The Free Encyclopedia. Retrieved 15:03, July 7, 2019, from https://en.wikipedia.org/w/index.php?title=Sequence_homology&oldid=903749549
- Wikipedia contributors. (2019, May 30). Molecular evolution. In Wikipedia, The Free Encyclopedia. Retrieved 14:36, July 7, 2019, from https://en.wikipedia.org/w/index.php?title=Molecular_evolution&oldid=899482839
- Wikipedia contributors. (2019, July 6). Genetic code. In Wikipedia, The Free Encyclopedia. Retrieved 14:02, July 7, 2019, from https://en.wikipedia.org/w/index.php?title=Genetic_code&oldid=905083507
- Song, K., and Le, D. (2019) Bond Energies. In LibreTexts OER Publication, Physical and Theoretical Chemistry. Retrieved on July 6th, 2019 from: https://chem.libretexts.org/Bookshelves/Physical_and_Theoretical_Chemistry_Textbook_Maps/Supplemental_Modules_(Physical_and_Theoretical_Chemistry)/Chemical_Bonding/Fundamentals_of_Chemical_Bonding/Bond_Energies
- Arunan, Elangannan; Desiraju, Gautam R.; Klein, Roger A.; Sadlej, Joanna; Scheiner, Steve; Alkorta, Ibon; Clary, David C.; Crabtree, Robert H.; Dannenberg, Joseph J.; Hobza, Pavel; Kjaergaard, Henrik G.; Legon, Anthony C.; Mennucci, Benedetta; Nesbitt, David J. (2011). “Definition of the hydrogen bond”. Pure Appl. Chem. 83 (8): 1637–1641. doi:10.1351/PAC-REC-10-01-02
- Aoi, W. and Marunaka, Y. (2014) Importance of pH Homeostasis in Metabolic Health and Diseases: Crucial Role of Membrane Proton Transport. BioMed Res. Int., Article ID:598986 from: https://www.hindawi.com/journals/bmri/2014/598986/#copyright

