Home » Student Resources » Online Chemistry Textbooks » CH104: Chemistry and the Environment » CH104: Chapter 6 – Quantities in Chemical Reactions
MenuCH104: Chemistry and the Environment
Chapter 6 – Quantities in Chemical Reactions
This text is published under creative commons licensing, for referencing and adaptation, please click here.
6.1: Chapter Introduction
6.2: The Mole
6.3: Atomic and Molar Mass
6.4: Mole-Mass Conversions
6.5: Mole-Mole Relationships in Chemical Reactions
6.6: Mole-Mass and Mass-Mass Problems
6.7: Limiting Reagent and Percent Yield
6.8: Focus on the Environment – Global Climate Change
6.9: Chapter Summary
6.10: References
6.1: Chapter Introduction
So far, we have talked about chemical reactions in terms of individual atoms and molecules. Although this works, most of the reactions occurring around us involve much larger amounts of chemicals. Even a tiny sample of a substance will contain millions, billions, or a hundred billion billions of atoms and molecules. How do we compare amounts of substances to each other in chemical terms when it is so difficult to count to a hundred billion billion?
Actually, there are ways to do this, which we will explore in this chapter. In doing so, we will increase our understanding of stoichiometry, which is the study of the numerical relationships between the reactants and the products in a balanced chemical reaction.
(Back to the Top)
6.2: The Mole
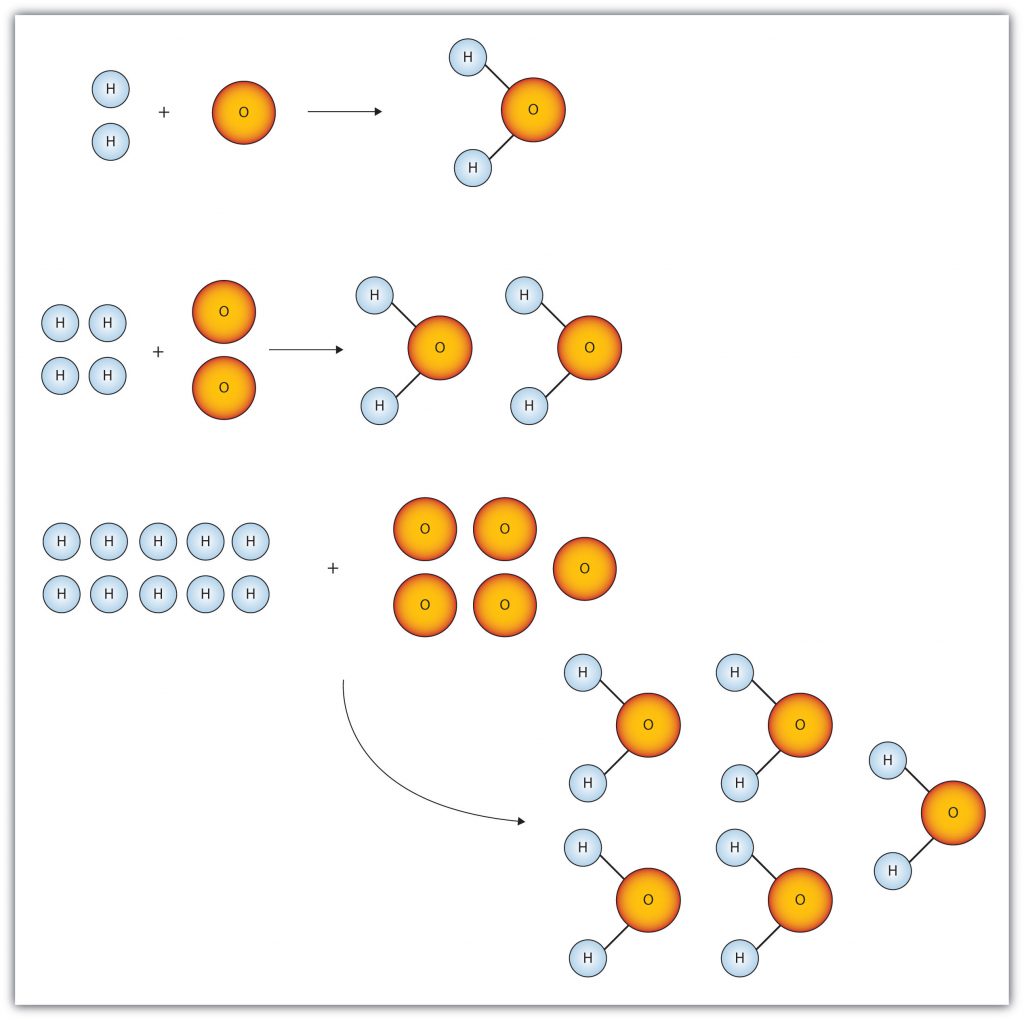
Figure 6.1 “Water Molecules” shows that we need 2 hydrogen atoms and 1 oxygen atom to make 1 water molecule. If we want to make 2 water molecules, we will need 4 hydrogen atoms and 2 oxygen atoms. If we want to make 5 molecules of water, we need 10 hydrogen atoms and 5 oxygen atoms. The ratio of atoms we will need to make any number of water molecules is the same: 2 hydrogen atoms to 1 oxygen atom.
Figure 6.1 Water Molecules: The ratio of hydrogen atoms to oxygen atoms used to make water molecules is always 2:1, no matter how many water molecules are being made.
One problem we have, however, is that it is extremely difficult, if not impossible, to organize atoms one at a time. As stated in the introduction, we deal with billions of atoms at a time. How can we keep track of so many atoms (and molecules) at a time? We do it by using mass rather than by counting individual atoms.
A hydrogen atom has a mass of approximately 1 u. An oxygen atom has a mass of approximately 16 u. The ratio of the mass of an oxygen atom to the mass of a hydrogen atom is therefore approximately 16:1.
If we have 2 atoms of each element, the ratio of their masses is approximately 32:2, which reduces to 16:1—the same ratio. If we have 12 atoms of each element, the ratio of their total masses is approximately (12 × 16):(12 × 1), or 192:12, which also reduces to 16:1. If we have 100 atoms of each element, the ratio of the masses is approximately 1,600:100, which again reduces to 16:1. As long as we have equal numbers of hydrogen and oxygen atoms, the ratio of the masses will always be 16:1.
The same consistency is seen when ratios of the masses of other elements are compared. For example, the ratio of the masses of silicon atoms to equal numbers of hydrogen atoms is always approximately 28:1, while the ratio of the masses of calcium atoms to equal numbers of lithium atoms is approximately 40:7.
So we have established that the masses of atoms are constant with respect to each other, as long as we have the same number of each type of atom. Consider a more macroscopic example. If a sample contains 40 g of Ca, this sample has the same number of atoms as there are in a sample of 7 g of Li. What we need, then, is a number that represents a convenient quantity of atoms so we can relate macroscopic quantities of substances. Clearly even 12 atoms are too few because atoms themselves are so small. We need a number that represents billions and billions of atoms.
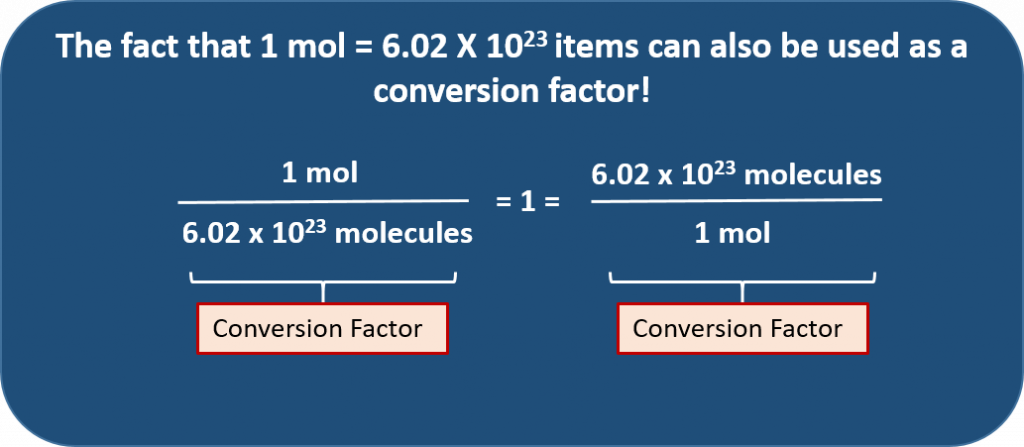
A mole is defined as 6.02 × 10²³ items and thus, it is used by chemists to represent a large number of atoms or molecules. Just as a dozen implies 12 things, a mole (abbreviated mol) represents 6.02 × 10²³ things. The number 6.02 × 10²³, called Avogadro’s number, after the 19th-century chemist Amedeo Avogadro, is the number we use in chemistry to represent macroscopic amounts of atoms and molecules. Thus, if we have 6.02 × 10²³ Oxygen atoms, we say we have 1 mole of Oxygen atoms. If we have 2 mol of Na atoms, we have 2 × (6.02 × 1023) Na atoms, or 1.2044 × 1024 Na atoms. Similarly, if we have 0.5 mol of benzene (C6H6) molecules, we have 0.5 × (6.02 × 1023) C6H6 molecules, or 3.011 × 10²³ C6H6 molecules.
Notice that we are applying the mole unit to different types of chemical entities. In these examples, we cited moles of atoms and moles of molecules. The word mole represents a number of things—6.02 × 10²³ of them—but does not by itself specify what “they” are. They can be atoms, formula units (of ionic compounds), or molecules. That information still needs to be specified.
Because 1 H2 molecule contains 2 H atoms, 1 mol of H2 molecules (6.02 × 10²³ molecules) has 2 mol of H atoms. Using formulas to indicate how many atoms of each element we have in a substance, we can relate the number of moles of molecules to the number of moles of atoms. For example, in 1 mol of ethanol (C2H6O), we can construct the following relationships (Table 6.1 “Molecular Relationships”):
Table 6.1: Molecular Relationships
The following example illustrates how we can use these relationships as conversion factors.
(Back to the Top)
6.3: Atomic and Molar Mass
Now that we have introduced the mole and practiced using it as a conversion factor, we ask the obvious question: why is the mole that particular number of things? Why is it 6.022 × 10²³ and not 1 × 10²³ or even 1 × 10²⁰?
The number in a mole, Avogadro’s number, is related to the relative sizes of the atomic mass unit and gram mass units. Whereas one hydrogen atom has a mass of approximately 1 amu, 1 mol of H atoms has a mass of approximately 1 gram. And whereas one sodium atom has an approximate mass of 23 amu, 1 mol of Na atoms has an approximate mass of 23 grams.
One mole of a substance has the same mass in grams that one atom or molecule has in atomic mass units. The numbers in the periodic table that we identified as the atomic masses of the atoms not only tell us the mass of one atom in atomic mass units, but also tell us the mass of 1 mole of atoms in grams! This is because all atoms are made up of the same parts (protons, neutrons, and electrons) with the protons and neutrons having nearly identical masses. Electrons, since they are so light, are negligent in their contribution to atomic mass, even in the largest atoms. Thus, an atomic or molecular mass is indicative of how many atoms or molecules are present. Thus, an important three way relationship is formed: 1 mol = atomic or molecular mass in grams = 6.02 X 10²³ atoms or molecules. This effectively gives us a way to count molecules in the laboratory using a common balance! Note that in chemical equations and calculations that mole concentrations are abbreviated as mol.
Recall that, the mass of an ionic compound (referred to as the formula mass) or a covalent molecule (referred to as the molecular mass)—is simply the sum of the masses of its atoms. To calculate formula or molecular masses, it is important that you keep track of the number of atoms of each element in the molecular formula to obtain the correct molecular mass.
For Example:
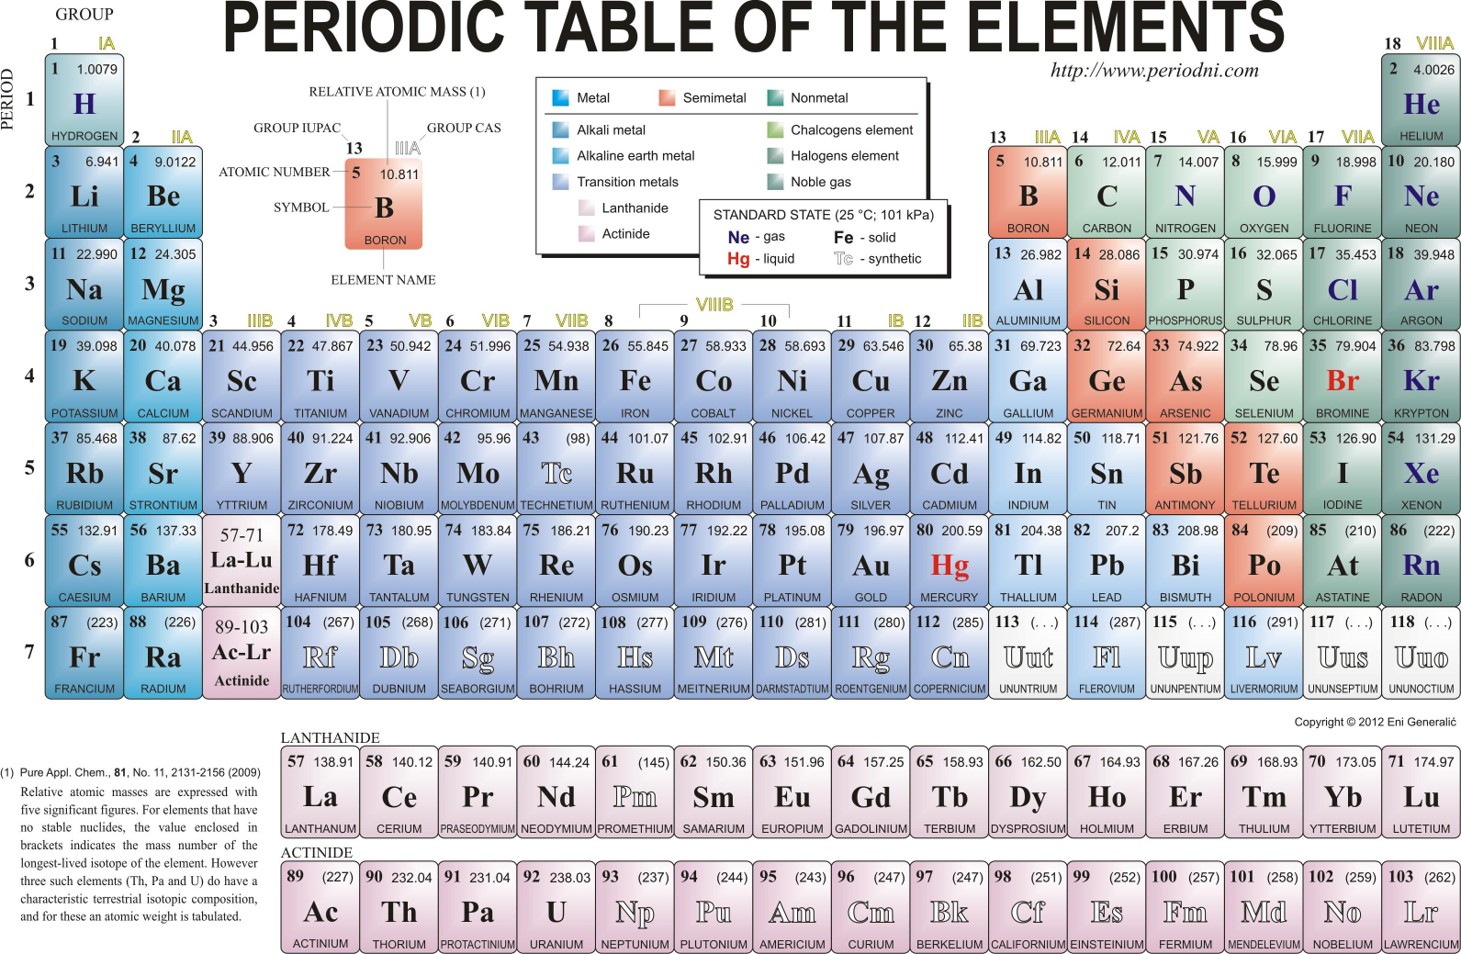
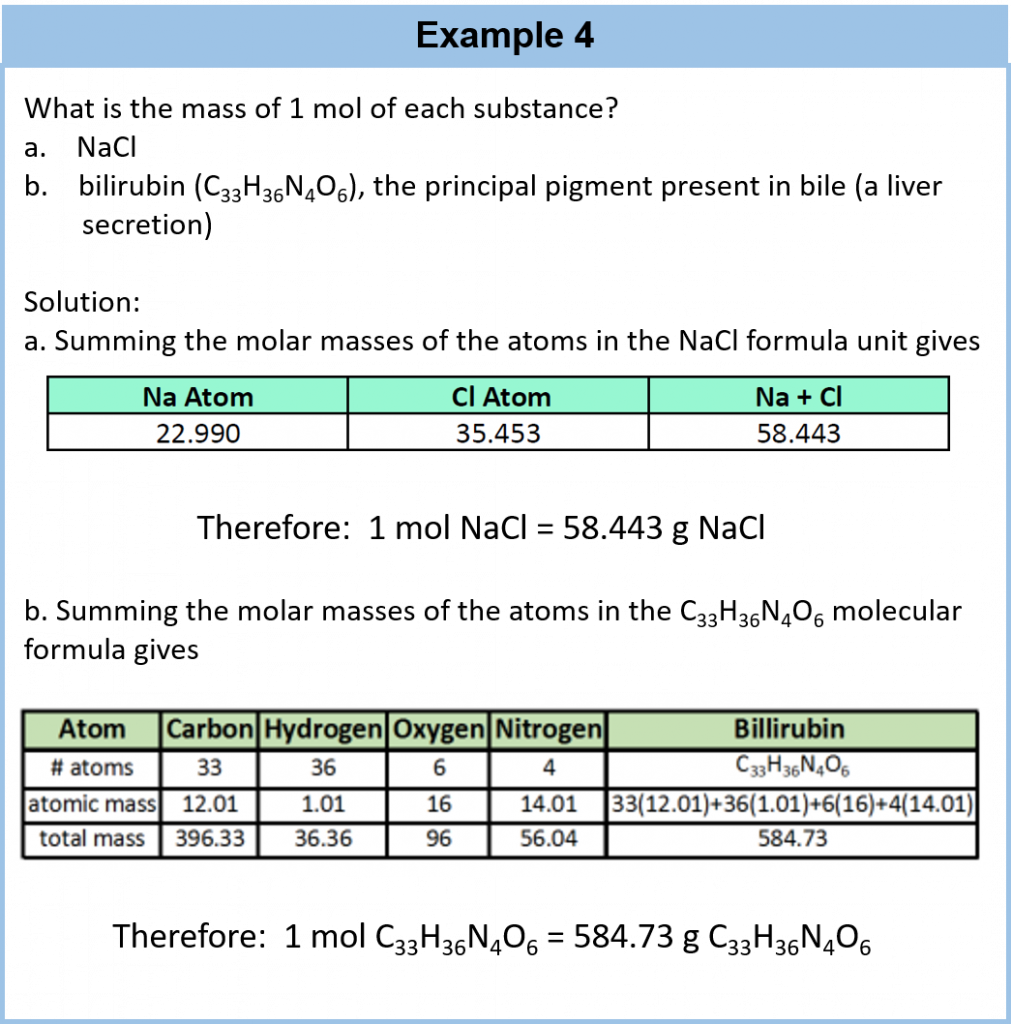
A molecule of NaCl contains 1 Na+ and 1 Cl–. Thus, we can the formula mass of this compound by adding together the atomic masses of sodium and chlorine, as found on the periodic table (Figure 6.1).
Figure 6.1 Periodic Table of the Elements
For a larger molecule, like glucose (C6H12O6), that has multiple atoms of the same type, simply multiply the atomic mass of each atom by the number of atoms present, and then add up all the atomic masses to get the final molecular mass.
The mole concept can be extended to masses of formula units and molecules as well. The mass of 1 mol of molecules (or formula units) in grams is numerically equivalent to the mass of one molecule (or formula unit) in atomic mass units. For example, a single molecule of O2 has a mass of 32.00 u (the sum of 2 oxygen atoms), and 1 mol of O2 molecules has a mass of 32.00 g. As with atomic mass unit–based masses, to obtain the mass of 1 mol of a substance, we simply sum the masses of the individual atoms in the formula of that substance. The mass of 1 mol of a substance is referred to as its molar mass, whether the substance is an element, an ionic compound, or a covalent compound.
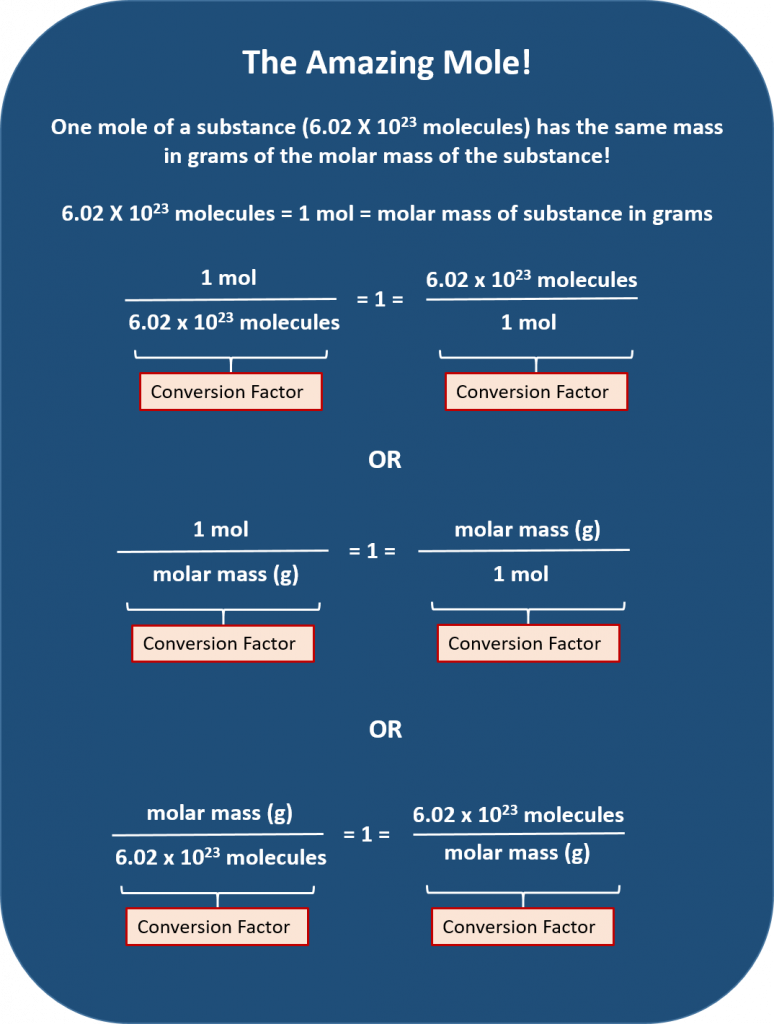
Figure 6.2: The Amazing Mole. The major mole conversion factors are shown.
The relationship of the mole quantities to gram conversion factors listed above in Figure 6.2 are notably some of the most useful equations in all of chemistry. They make it possible to set up chemical reactions in a safe and efficient manner and they have tremendous impact on the economics of many industrial and manufacturing processes and the production of medicine. If you are a serious student of chemistry, I would recommend printing out table 6.2 and keeping a copy in your notebook. It will be extremely useful in setting up a multitude of word problems and is functionally useful in the laboratory.
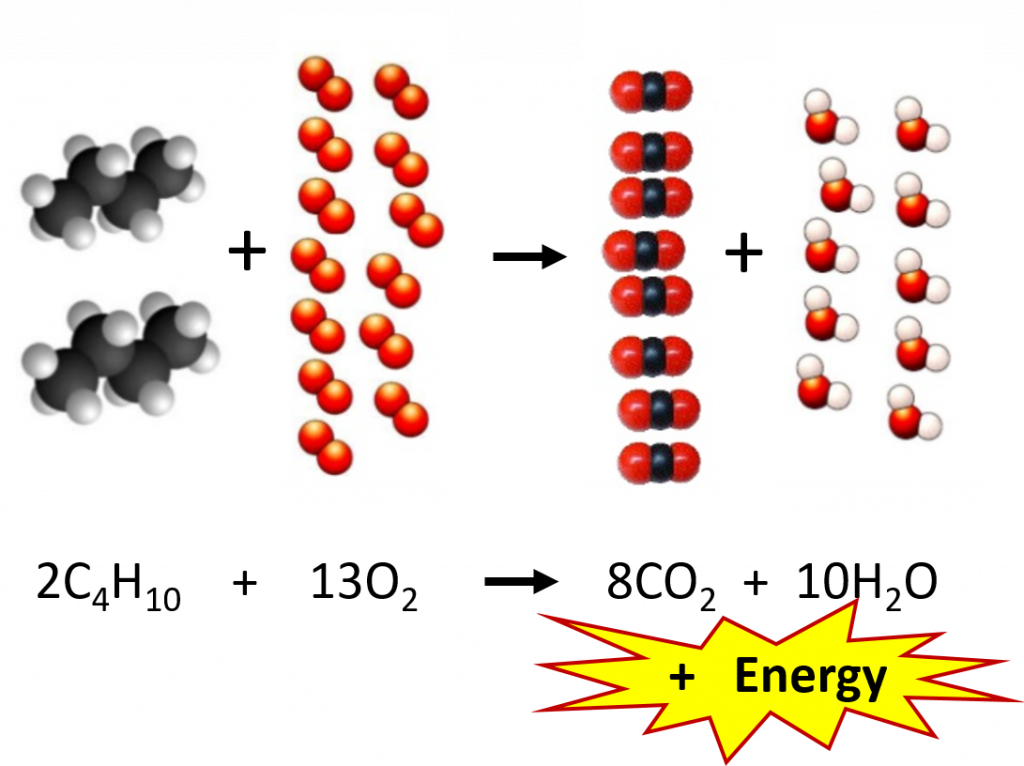
So why is the relationship between the mole and compound mass so important? In the microscopic world, chemical equations are set up on the scale of molecules. Figure 6.3 depicts a typical chemical reaction. As we learned in Chapter 5, the coefficients in front of each compound represent the number of molecules needed for the reaction to proceed. In this combustion reaction, 2 molecules of butane (C4H10) react with 13 molecules of oxygen to produce 8 molecules of carbon dioxide and 10 molecules of water. In the lab, however, chemists are unable to count out molecules and place them in a reaction flask. Molecules are way too small to be seen by the naked eye and there is no equipment available that is capable of sorting and counting molecules in this way. Mass, on the other hand, can easily be measured using a balance. Thus, the relationship of mass to the number of molecules present becomes a very important conversion. Since the mole represents a fixed number of molecules (6.02 X 10²³), the coefficients used in chemical reactions can also be thought of as molar ratios. Instead of reading our equation in terms of molecules, we can read it in terms of moles. At the macroscopic level, the reaction below reads: 2 moles of butane (C4H10) react with 13 moles of oxygen to produce 8 moles of carbon dioxide and 10 moles of water.
Figure 6.3 Combustion Reaction of Butane. The example shows the molecular ratios of the substrates and products of the reaction.
6.4 Mole-Mass Conversions
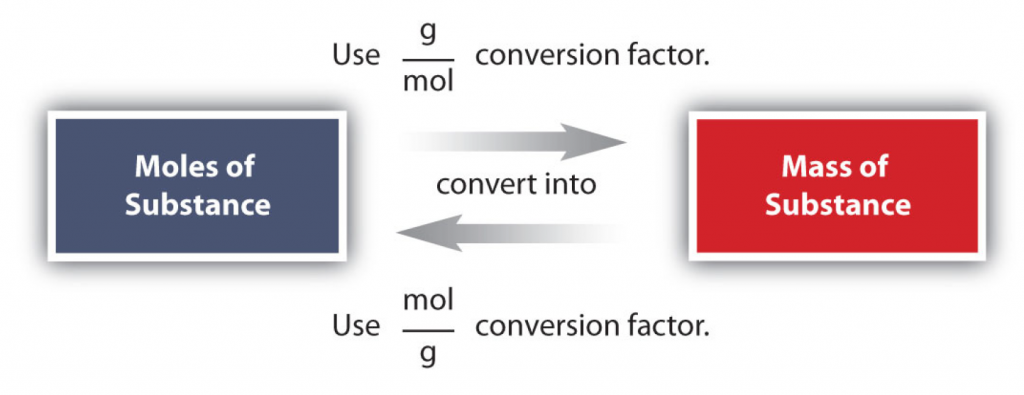
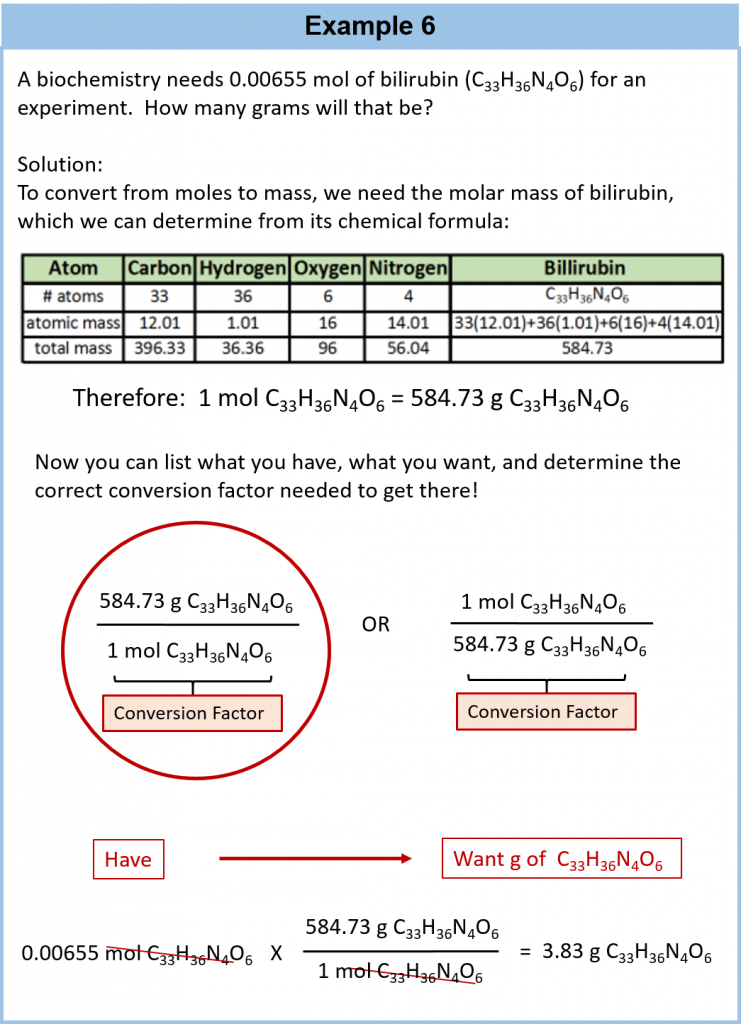
The simplest type of manipulation using molar mass as a conversion factor is a mole-mass conversion (or its reverse, a mass-mole conversion), as shown in Figure 6.2. In such a conversion, we use the molar mass of a substance as a conversion factor to convert mole units into mass units (or, conversely, mass units into mole units).
We established that 1 mol of Al has a mass of 26.98 g (Example 3 in Section 6.3). Stated mathematically,
1 mol Al = 26.98 g Al
We can divide both sides of this expression by either side to get one of two possible conversion factors:
The first conversion factor can be used to convert from mass to moles, and the second converts from moles to mass. Both can be used to solve problems.
Conversions like this are possible for any substance, as long as the proper atomic mass, formula mass, or molar mass is known (or can be determined) and expressed in grams per mole. Figure 6.4 is a chart for determining what conversion factor is needed, and Figure 6.5 is a flow diagram for the steps needed to perform a conversion. Note that it takes one mathematical step to convert from moles to mass or from mass to moles.
To Your Health: Minerals
For our bodies to function properly, we need to ingest certain substances from our diets. Among our dietary needs are minerals, the non-carbon elements, our body uses for a variety of functions, such developing bone or ensuring proper nerve transmission.
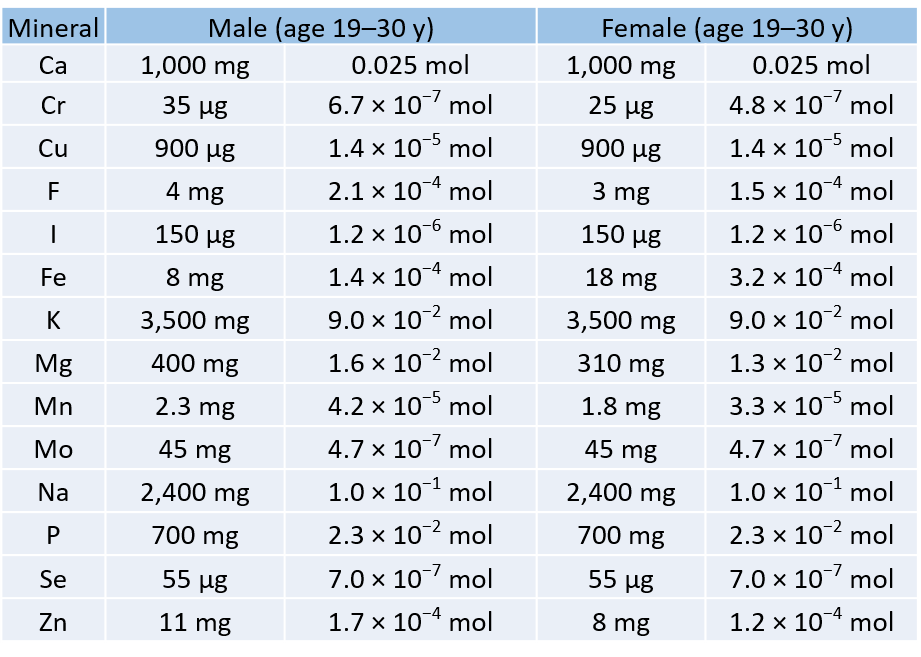
The US Department of Agriculture has established some recommendations for the daily intake (RDIs) of various minerals. The accompanying table lists the RDIs for minerals, both in mass and moles, assuming a 2,000-calorie daily diet.
Table 6.2: Recommended Daily Intake (RDIs) of Mineral Supplements
Table 6.2 illustrates several things. First, the needs of men and women for some minerals are different. The extreme case is for iron; women need over twice as much as men do. In all other cases where there is a different RDI, men need more than women.
Second, the amounts of the various minerals needed on a daily basis vary widely—both on a mass scale and a molar scale. The average person needs 0.1 mol of Na a day, which is about 2.5 g. On the other hand, a person needs only about 25–35 µg of Cr per day, which is under one millionth of a mole. As small as this amount is, a deficiency of chromium in the diet can lead to diabetes-like symptoms or neurological problems, especially in the extremities (hands and feet). For some minerals, the body does not require much to keep itself operating properly.
Although a properly balanced diet will provide all the necessary minerals, some people take dietary supplements. However, too much of a good thing, even minerals, is not good. Exposure to too much chromium, for example, causes a skin irritation, and certain forms of chromium are known to cause cancer (as presented in the movie Erin Brockovich).
(Back to the Top)
6.5 Mole-Mole Relationships in Chemical Reactions
In this section you will learn how to use a balanced chemical reaction to determine molar relationships between the substances.
In Chapter 5, you learned to balance chemical equations by comparing the numbers of each type of atom in the reactants and products. The coefficients in front of the chemical formulas represent the numbers of molecules or formula units (depending on the type of substance). Here, we will extend the meaning of the coefficients in a chemical equation.
Consider the simple chemical equation
2H2 + O2 → 2H2O
The convention for writing balanced chemical equations is to use the lowest whole-number ratio for the coefficients. However, the equation is balanced as long as the coefficients are in a 2:1:2 ratio. For example, this equation is also balanced if we write it as
4H2 + 2O2 → 4H2O
The ratio of the coefficients is 4:2:4, which reduces to 2:1:2. The equation is also balanced if we were to write it as
22H2 + 11O2 → 22H2O
because 22:11:22 also reduces to 2:1:2.
Suppose we want to use larger numbers. Consider the following coefficients:
12.044 × 10²³ H2 + 6.022 × 10²³ O2 → 12.044 × 10²³ H2O
These coefficients also have the ratio 2:1:2 (check it and see), so this equation is balanced. But 6.022 × 10²³ is 1 mol, while 12.044 × 10²³ is 2 mol (and the number is written that way to make this more obvious), so we can simplify this version of the equation by writing it as
2 mol H2 + 1 mol O2 → 2 mol H2O
We can leave out the word mol and not write the 1 coefficient (as is our habit), so the final form of the equation, still balanced, is
2H2 + O2 → 2H2O
Now we interpret the coefficients as referring to molar amounts, not individual molecules. The lesson? Balanced chemical equations are balanced not only at the molecular level but also in terms of molar amounts of reactants and products. Thus, we can read this reaction as “two moles of hydrogen react with one mole of oxygen to produce two moles of water.”
By the same token, the ratios we constructed in Chapter 5, can also be constructed in terms of moles rather than molecules. For the reaction in which hydrogen and oxygen combine to make water, for example, we can construct the following ratios:
We can use these ratios to determine what amount of a substance, in moles, will react with or produce a given number of moles of a different substance. The study of the numerical relationships between the reactants and the products in balanced chemical reactions is called stoichiometry.
6.6 Mole-Mass and Mass-Mass Problems
In this section you will learn to convert from mass or moles of one substance to mass or moles of another substance in a chemical reaction.
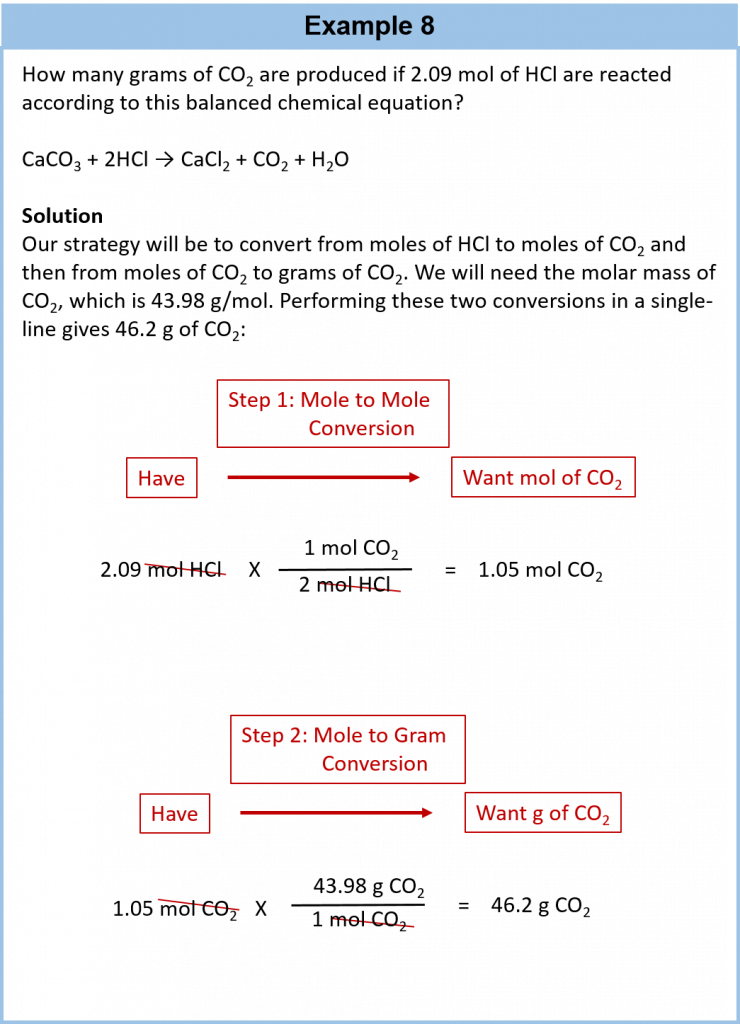
We have established that a balanced chemical equation is balanced in terms of moles as well as atoms or molecules. We have used balanced equations to set up ratios, now in terms of moles of materials, that we can use as conversion factors to answer stoichiometric questions, such as how many moles of substance A react with so many moles of reactant B. We can extend this technique even further. Recall that we can relate a molar amount to a mass amount using molar mass. We can use that ability to answer stoichiometry questions in terms of the masses of a particular substance, in addition to moles. We do this using the following sequence:
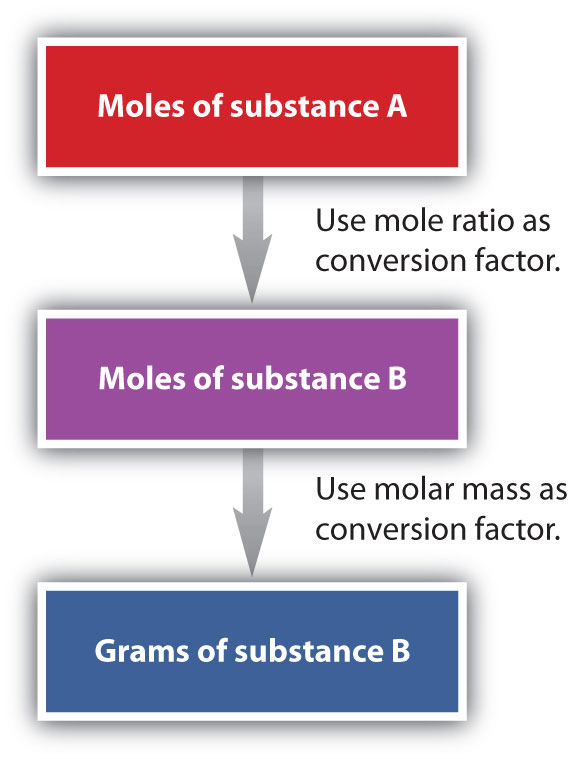
Figure 6.6: Flowchart for Calculating Mole to Mass Conversions using Chemical Equations.
Collectively, these conversions are called mole-mass calculations.
As an example, consider the balanced chemical equation
Fe2O3 + 3SO3 → Fe2(SO4)3
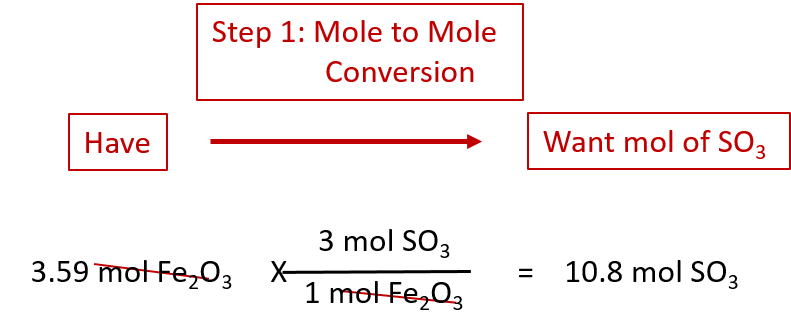
If we have 3.59 mol of Fe2O3, how many grams of SO3 can react with it? Using the mole-mass calculation sequence, we can determine the required mass of SO3 in two steps. First, we construct the appropriate molar ratio, determined from the balanced chemical equation, to calculate the number of moles of SO3 needed. Then using the molar mass of SO3 as a conversion factor, we determine the mass that this number of moles of SO3 has. Graphically, it is represented in these two steps:
The first step resembles the exercises we did in Section 6.4 “Mole-Mole Relationships in Chemical Reactions”. As usual, we start with the quantity we were given:
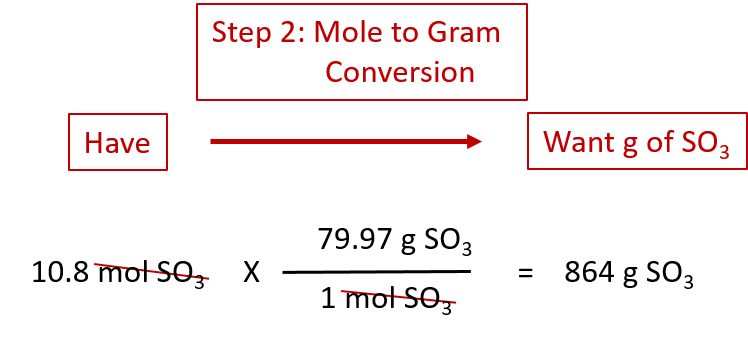
The mol Fe2O3 units cancel, leaving mol SO3 unit. Now, we take this answer and convert it to grams of SO3, using the molar mass of SO3 as the conversion factor:
Our final answer is expressed to three significant figures. Thus, in a two-step process, we find that 862 g of SO3 will react with 3.59 mol of Fe2O3. Many problems of this type can be answered in this manner.
The same two-step problem can also be worked out in a single line, rather than as two separate steps, as follows:

We get exactly the same answer when combining all the math steps together as we do when we calculate one step at a time.

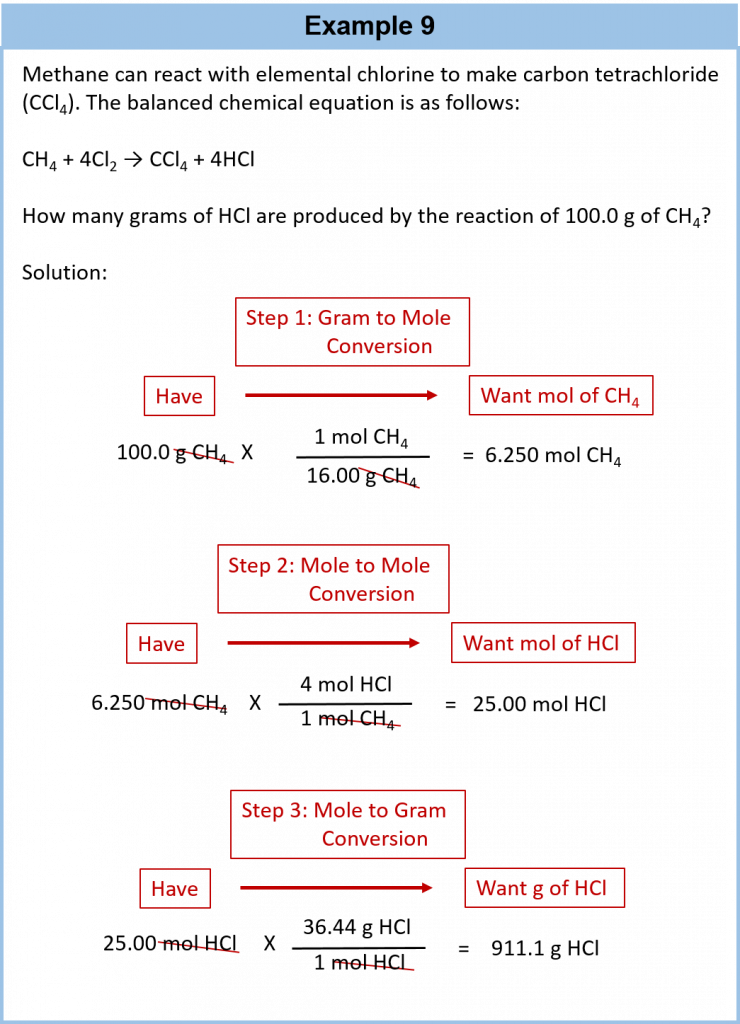
It is a small step from mole-mass calculations to mass-mass calculations. If we start with a known mass of one substance in a chemical reaction (instead of a known number of moles), we can calculate the corresponding masses of other substances in the reaction. The first step in this case is to convert the known mass into moles, using the substance’s molar mass as the conversion factor. Then—and only then—we use the balanced chemical equation to construct a conversion factor to convert that quantity to moles of another substance, which in turn can be converted to a corresponding mass. Sequentially, the process is as follows:
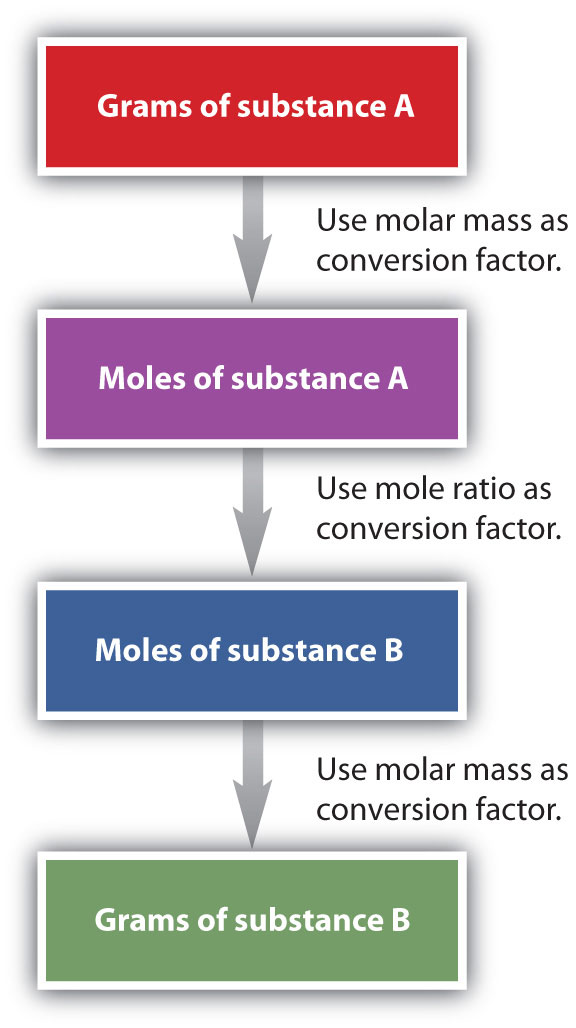
This three-part process can be carried out in three discrete steps or combined into a single calculation that contains three conversion factors. The following example illustrates both techniques.

To Your Health: The Synthesis of Taxol
Taxol is a powerful anticancer drug that was originally extracted from the Pacific yew tree (Taxus brevifolia). As you can see from the accompanying figure, taxol is a very complicated molecule, with a molecular formula of C47H51NO14. Isolating taxol from its natural source presents certain challenges, mainly that the Pacific yew is a slow-growing tree, and the equivalent of six trees must be harvested to provide enough taxol to treat a single patient. Although related species of yew trees also produce taxol in small amounts, there is significant interest in synthesizing this complex molecule in the laboratory.
After a 20-year effort, two research groups announced the complete laboratory synthesis of taxol in 1994. However, each synthesis required over 30 separate chemical reactions, with an overall efficiency of less than 0.05%. To put this in perspective, to obtain a single 300 mg dose of taxol, you would have to begin with 600 g of starting material. To treat the 26,000 women who are diagnosed with ovarian cancer each year with one dose, almost 16,000 kg (over 17 tons) of starting material must be converted to taxol. Taxol is also used to treat breast cancer, with which 200,000 women in the United States are diagnosed every year. This only increases the amount of starting material needed.
Clearly, there is intense interest in increasing the overall efficiency of the taxol synthesis. An improved synthesis not only will be easier but also will produce less waste materials, which will allow more people to take advantage of this potentially life-saving drug.
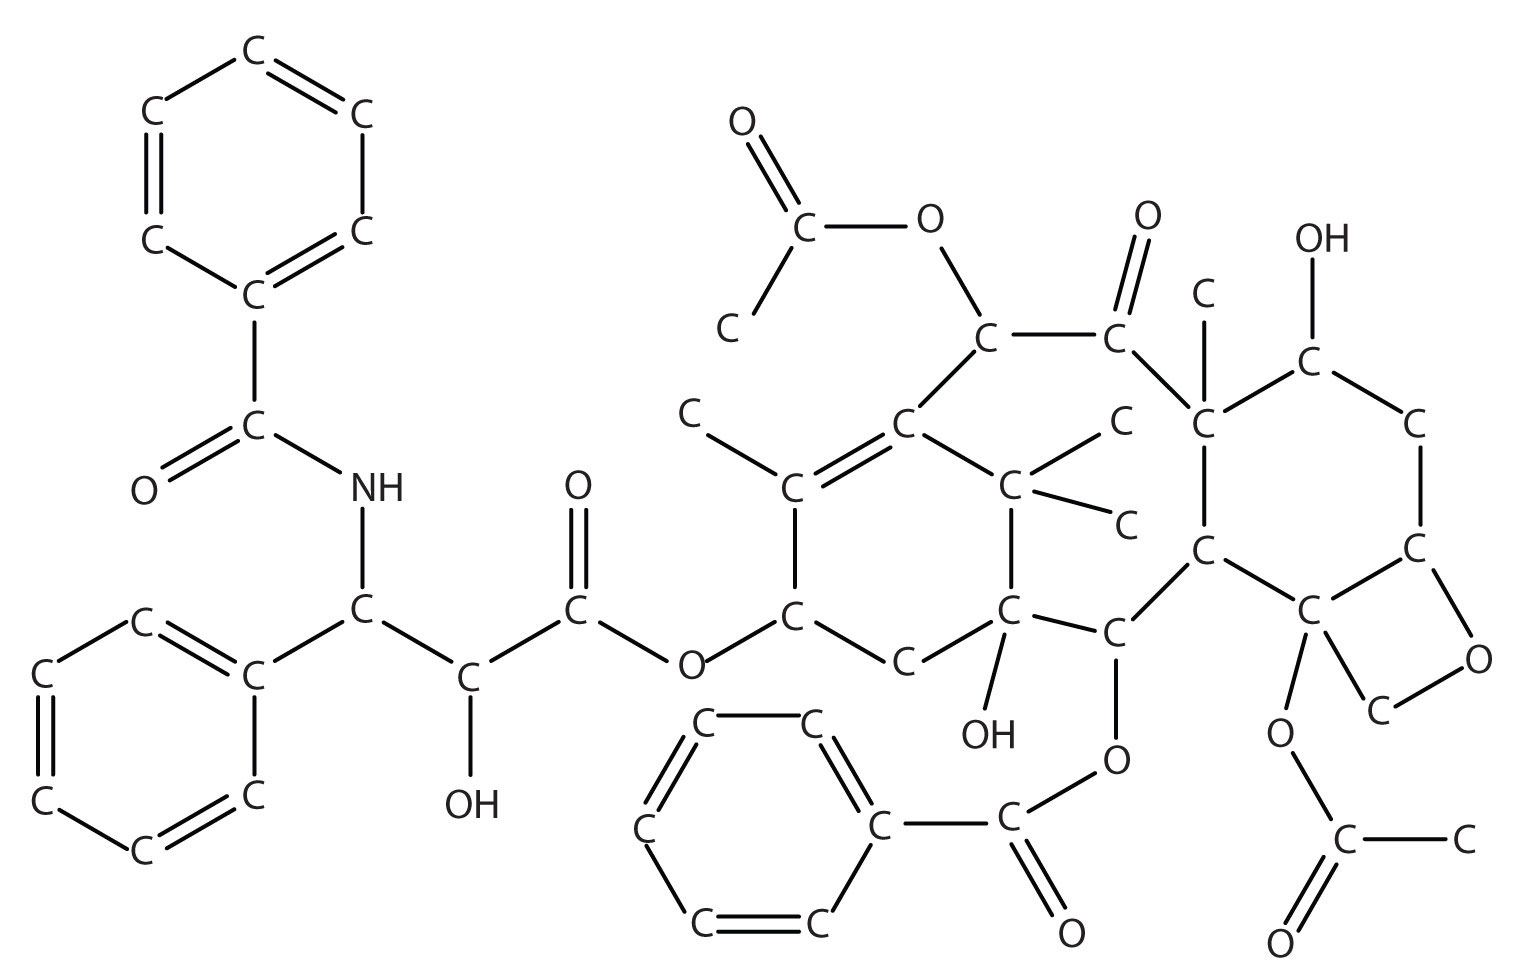
Figure 6.8 The Structure of the Cancer Drug Taxol. Because of the complexity of the molecule, hydrogen atoms are not shown, but they are present on every atom to give the atom the correct number of covalent bonds (four bonds for each carbon atom).
Key Takeaway
- A balanced chemical equation can be used to relate masses or moles of different substances in a reaction.
Exercises
-
Given the following unbalanced chemical equation,
H3PO4 + NaOH → H2O + Na3PO4
what mass of H2O is produced by the reaction of 2.35 mol of H3PO4?
-
Given the following unbalanced chemical equation,
C2H6 + Br2 → C2H4Br2 + HBr
what mass of HBr is produced if 0.884 mol of C2H6 is reacted?
-
Certain fats are used to make soap, the first step being to react the fat with water to make glycerol (also known as glycerin) and compounds called fatty acids. One example is as follows:
C3H5(OOC(CH2)14CH3)3a fat+3H2O→C3H5(OH)3glycerol+3CH3(CH2)14COOHfatty acid
-
How many moles of glycerol can be made from the reaction of 1,000.0 g of C3H5(OOC(CH2)14CH3)3?
-
Photosynthesis in plants leads to the general overall reaction for producing glucose (C6H12O6):
6CO2 + 6H2O → C6H12O6 + 6O2
How many moles of glucose can be made from the reaction of 544 g of CO2?
-
Precipitation reactions, in which a solid (called a precipitate) is a product, are commonly used to remove certain ions from solution. One such reaction is as follows:
Ba(NO3)2(aq) + Na2SO4(aq) → BaSO4(s) + 2NaNO3(aq)
How many grams of Na2SO4 are needed to precipitate all the barium ions produced by 43.9 g of Ba(NO3)2?
-
Nitroglycerin [C3H5(ONO2)3] is made by reacting nitric acid (HNO3) with glycerol [C3H5(OH)3] according to this reaction:
C3H5(OH)3 + 3HNO3 → C3H5(ONO2)3 + 3H2O
If 87.4 g of HNO3 are reacted with excess glycerol, what mass of nitroglycerin can be made?
-
Antacids are bases that neutralize acids in the digestive tract. Magnesium hydroxide [Mg(OH)2] is one such antacid. It reacts with hydrochloric acid in the stomach according to the following reaction:
Mg(OH)2 + 2HCl → MgCl2 + 2H2O
How many grams of HCl can a 200 mg dose of Mg(OH)2 neutralize?
-
Acid rain is caused by the reaction of nonmetal oxides with water in the atmosphere. One such reaction involves nitrogen dioxide (NO2) and produces nitric acid (HNO3):
3NO2 + H2O → 2HNO3 + NO
If 1.82 × 10¹³ g of NO2 enter the atmosphere every year due to human activities, potentially how many grams of HNO3 can be produced annually?
-
A simplified version of the processing of iron ore into iron metal is as follows:
2Fe2O3 + 3C → 4Fe + 3CO2
How many grams of C are needed to produce 1.00 × 10⁹ g of Fe?
-
The SS Hindenburg contained about 5.33 × 10⁵ g of H2 gas when it burned at Lakehurst, New Jersey, in 1937. The chemical reaction is as follows:
2H2 + O2 → 2H2O
How many grams of H2O were produced?
Answers
-
127 g
-
1.236 mol
-
23.9 g
-
0.251 g
-
1.61 × 10⁸ g
(Back to the Top)
6.7 Limiting Reagent and Percent Yield
By the end of this section, you will be able to:
- Explain the concepts of theoretical yield and limiting reactants/reagents.
- Derive the theoretical yield for a reaction under specified conditions.
- Calculate the percent yield for a reaction.
The relative amounts of reactants and products represented in a balanced chemical equation are often referred to as stoichiometric amounts. All the exercises of the preceding module involved stoichiometric amounts of reactants. For example, when calculating the amount of product generated from a given amount of reactant, it was assumed that any other reactants required were available in stoichiometric amounts (or greater). In this module, more realistic situations are considered, in which reactants are not present in stoichiometric amounts.
Limiting Reagent
Consider another food analogy, making grilled cheese sandwiches (Fig. 6.9)
Stoichiometric amounts of sandwich ingredients for this recipe are bread and cheese slices in a 2:1 ratio. Provided with 28 slices of bread and 11 slices of cheese, one may prepare 11 sandwiches per the provided recipe, using all the provided cheese and having six slices of bread left over. In this scenario, the number of sandwiches prepared has been limited by the number of cheese slices, and the bread slices have been provided in excess.
Consider this concept now with regard to a chemical process, the reaction of hydrogen with chlorine to yield hydrogen chloride:
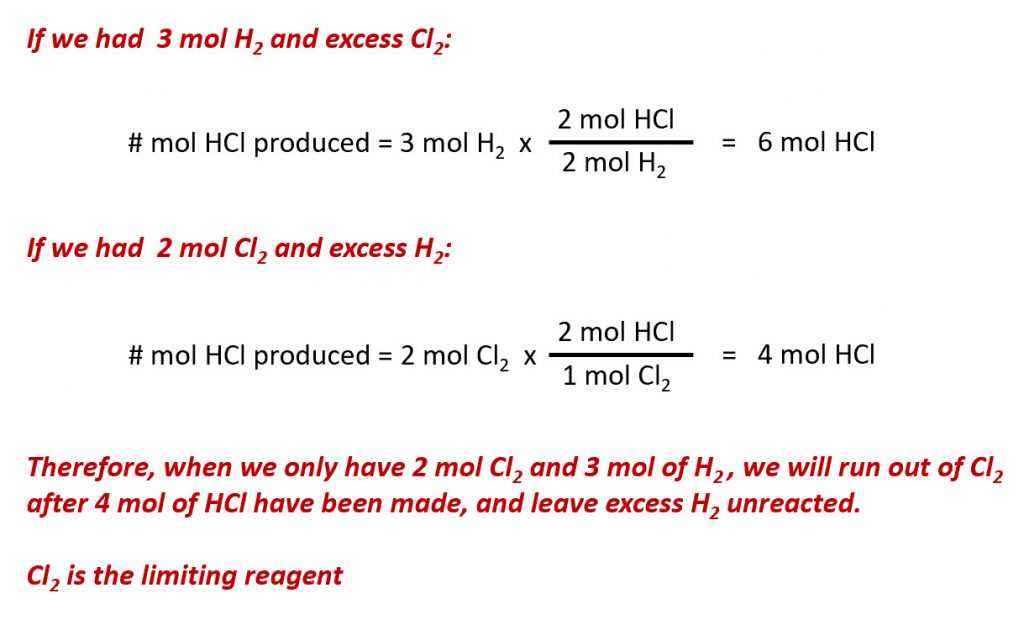
The balanced equation shows the hydrogen and chlorine react in a 1:1 stoichiometric ratio. If these reactants are provided in any other amounts, one of the reactants will nearly always be entirely consumed, thus limiting the amount of product that may be generated. This substance is the limiting reagent, and the other substance is the excess reagent. Identifying the limiting and excess reactants for a given situation requires computing the molar amounts of each reactant provided and comparing them to the stoichiometric amounts represented in the balanced chemical equation. For example, imagine combining 3 moles of H2 and 2 moles of Cl2. This represents a 3:2 (or 1.5:1) ratio of hydrogen to chlorine present for reaction, which is greater than the stoichiometric ratio of 1:1. Hydrogen, therefore, is present in excess, and chlorine is the limiting reactant. Reaction of all the provided chlorine (2 mol) will consume 2 mol of the 3 mol of hydrogen provided, leaving 1 mol of hydrogen unreacted.
An alternative approach to identifying the limiting reactant involves comparing the amount of product expected for the complete reaction of each reactant. Each reactant amount is used to separately calculate the amount of product that would be formed per the reaction’s stoichiometry. The reactant yielding the lesser amount of product is the limiting reactant. For the example:
As seen above, the chlorine will be completely consumed once 4 moles of HCl have been produced. Since enough hydrogen was provided to yield 6 moles of HCl, there will be unreacted hydrogen remaining once this reaction is complete. Chlorine, therefore, is the limiting reactant and hydrogen is the excess reactant (Fig. 6.10).
Figure 6.10. Finding the Limiting Reagent. When H2 and Cl2 are combined in nonstoichiometric amounts, one of these reactants will limit the amount of HCl that can be produced. This illustration shows a reaction in which hydrogen is present in excess and chlorine is the limiting reactant.
Figure from: Wacowich-Sgarbi, S. and the Langara Chemistry Dept. (2018) BCCampus
Example Problem:
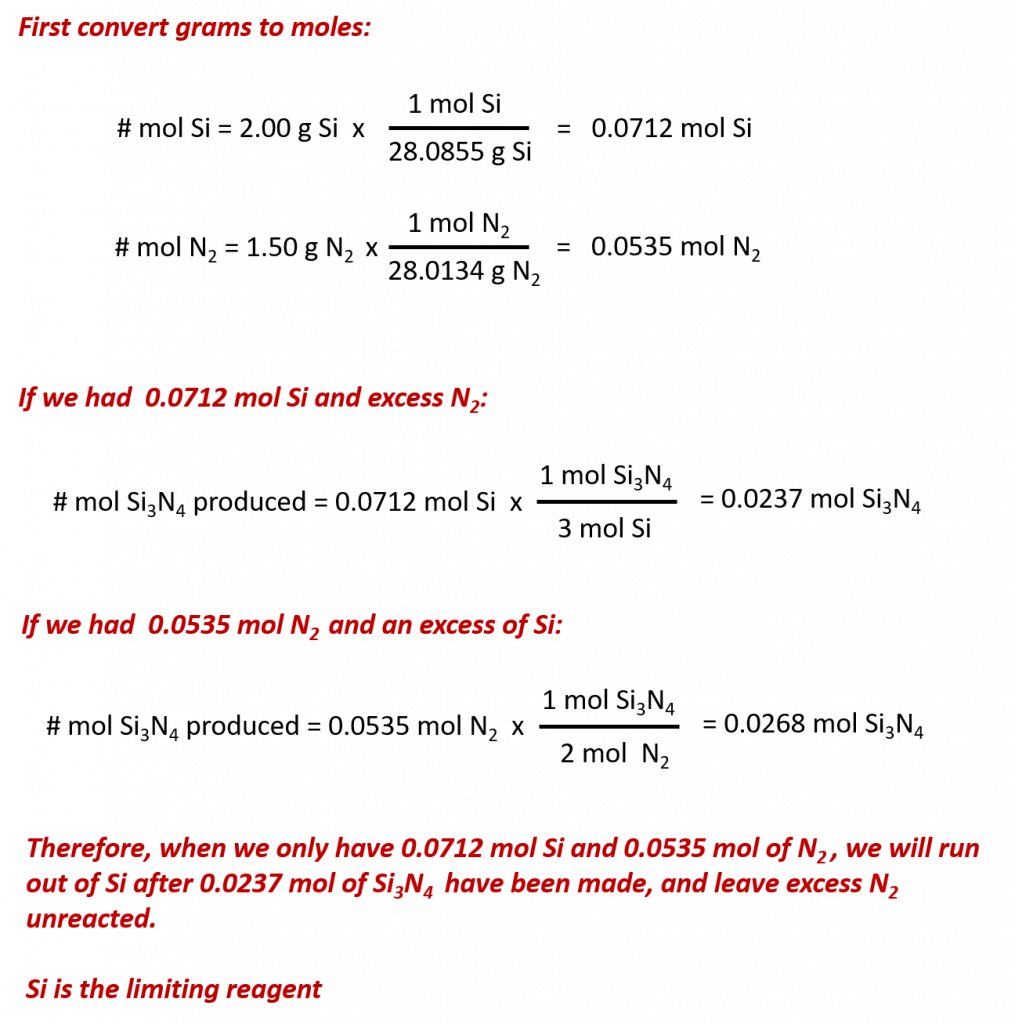
Silicon nitride is a very hard, high-temperature-resistant ceramic used as a component of turbine blades in jet engines. It is prepared according to the following equation:
Which is the limiting reactant when 2.00 g of Si and 1.50 g of N2 react?
Solution:
Test Yourself:
Which is the limiting reactant when 5.00 g of H2 and 10.0 g of O2 react and form water?
Answer
O2
Percent Yield
The amount of product that may be produced by a reaction under specified conditions, as calculated per the stoichiometry of an appropriate balanced chemical equation, is called the theoretical yield of the reaction. In practice, the amount of product obtained is called the actual yield, and it is often less than the theoretical yield for a number of reasons. Some reactions are inherently inefficient, being accompanied by side reactions that generate other products. Others are, by nature, incomplete. Some products are difficult to collect without some loss, and so less than perfect recovery will reduce the actual yield. The extent to which a reaction’s theoretical yield is achieved is commonly expressed as its percent yield:
Actual and theoretical yields may be expressed as masses or molar amounts (or any other appropriate property; e.g., volume, if the product is a gas). As long as both yields are expressed using the same units, these units will cancel when percent yield is calculated.
Example:
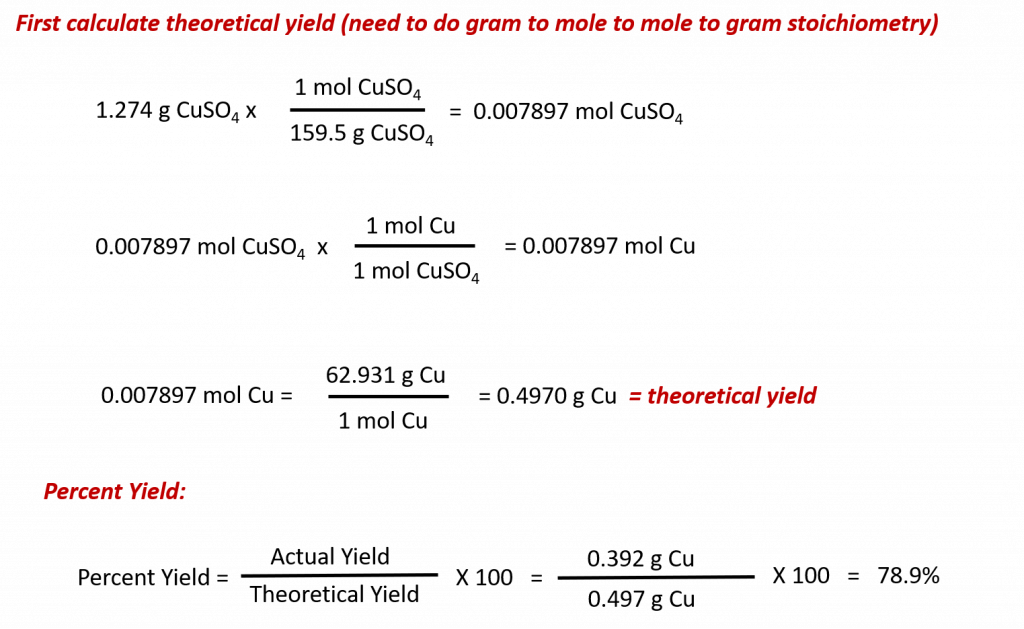
Upon reaction of 1.274 g of copper sulfate with excess zinc metal, 0.392 g copper metal was obtained according to the equation:
What is the percent yield?
Solution:
For this problem, we have been given the actual yield of copper, which is 0.392 g, and we have been giving the starting concentration of the copper sulfate reactant at 1.274 g. Thus, we need to calculate the theoretical yield before we can access the percent yield.
Test Yourself:
What is the percent yield of a reaction that produces 12.5 g of the gas Freon CF2Cl2 from 32.9 g of CCl4 and excess HF?
Green Chemistry and Atom Economy
The purposeful design of chemical products and processes that minimize the use of environmentally hazardous substances and the generation of waste is known as green chemistry. Green chemistry is a philosophical approach that is being applied to many areas of science and technology, and its practice is summarized by guidelines known as the “Twelve Principles of Green Chemistry” (see details at this website). One of the 12 principles is aimed specifically at maximizing the efficiency of processes for synthesizing chemical products. The atom economy of a process is a measure of this efficiency, defined as the percentage by mass of the final product of a synthesis relative to the masses of all the reactants used:
Though the definition of atom economy at first glance appears very similar to that for percent yield, be aware that this property represents a difference in the theoretical efficiencies of different chemical processes. The percent yield of a given chemical process, on the other hand, evaluates the efficiency of a process by comparing the yield of product actually obtained to the maximum yield predicted by stoichiometry.
The synthesis of the common nonprescription pain medication, ibuprofen, nicely illustrates the success of a green chemistry approach (Fig 6.11). First marketed in the early 1960s, ibuprofen was produced using a six-step synthesis that required 514 g of reactants to generate each mole (206 g) of ibuprofen, an atom economy of 40%.
6.8 Focus on the Environment – Global Climate Change
“The thickness of the air, compared to the size of the Earth, is something like the thickness of a coat of shellac on a schoolroom globe. Many astronauts have reported seeing that delicate, thin, blue aura at the horizon of the daylit hemisphere and immediately, unbidden, began contemplating its fragility and vulnerability. They have reason to worry.”
Carl Sagan, Billions and Billions (New York, NY: Random House 1997), 86.
Since the beginning of their history, humans have altered their environment. Only recently, however, have we realized how human activities influence earth’s terrestrial, hydrological, and atmospheric systems to the extent that these systems may no longer maintain the stable climate and services we have assumed as the basis of our economies. The science of climate change developed rapidly in the late twentieth century as researchers established a correlation between increasing atmospheric concentrations of certain gases, human activities emitting those gases, and a rapid increase in global temperatures. Many, but by no means all, international policy makers spurred research as it became apparent that impacts ranging from melting polar ice caps to acidified oceans and extreme weather patterns were attributed to anthropogenic (human) influences on climate. Global businesses, many of which initially balked at potential economic disruption from changes in the use of fossil fuel and other business practices, have largely acceded to the need for change. Nonetheless, the overall response to the challenge has been slow and not without resistance, thereby increasing the potential opportunities and urgency.
The Science of Global Climate Change
In the early 1820s, Joseph Fourier, the French pioneer in the mathematics of heat diffusion, became interested in why some heat from the sun was retained by the earth and its atmosphere rather than being reflected back into space. Fourier conceived of the atmosphere as a bell jar with the atmospheric gases retaining heat and thereby acting as the containing vessel. In 1896, Swedish Nobel laureate and physicist Svante August Arrhenius published a paper in which he calculated how carbon dioxide (CO2) could affect the temperature of the earth. He and early atmospheric scientists recognized that normal carbon dioxide levels in the atmosphere contributed to making the earth habitable. Scientists also have known for some time that air pollution alters weather. For example, certain industrial air pollutants can significantly increase rainfall downwind of their source. As intensive agriculture and industrial activity have expanded very rapidly around the world since 1850 (Figure 6.12), a growing body of scientific evidence has accumulated indicating that humans influence global climate.
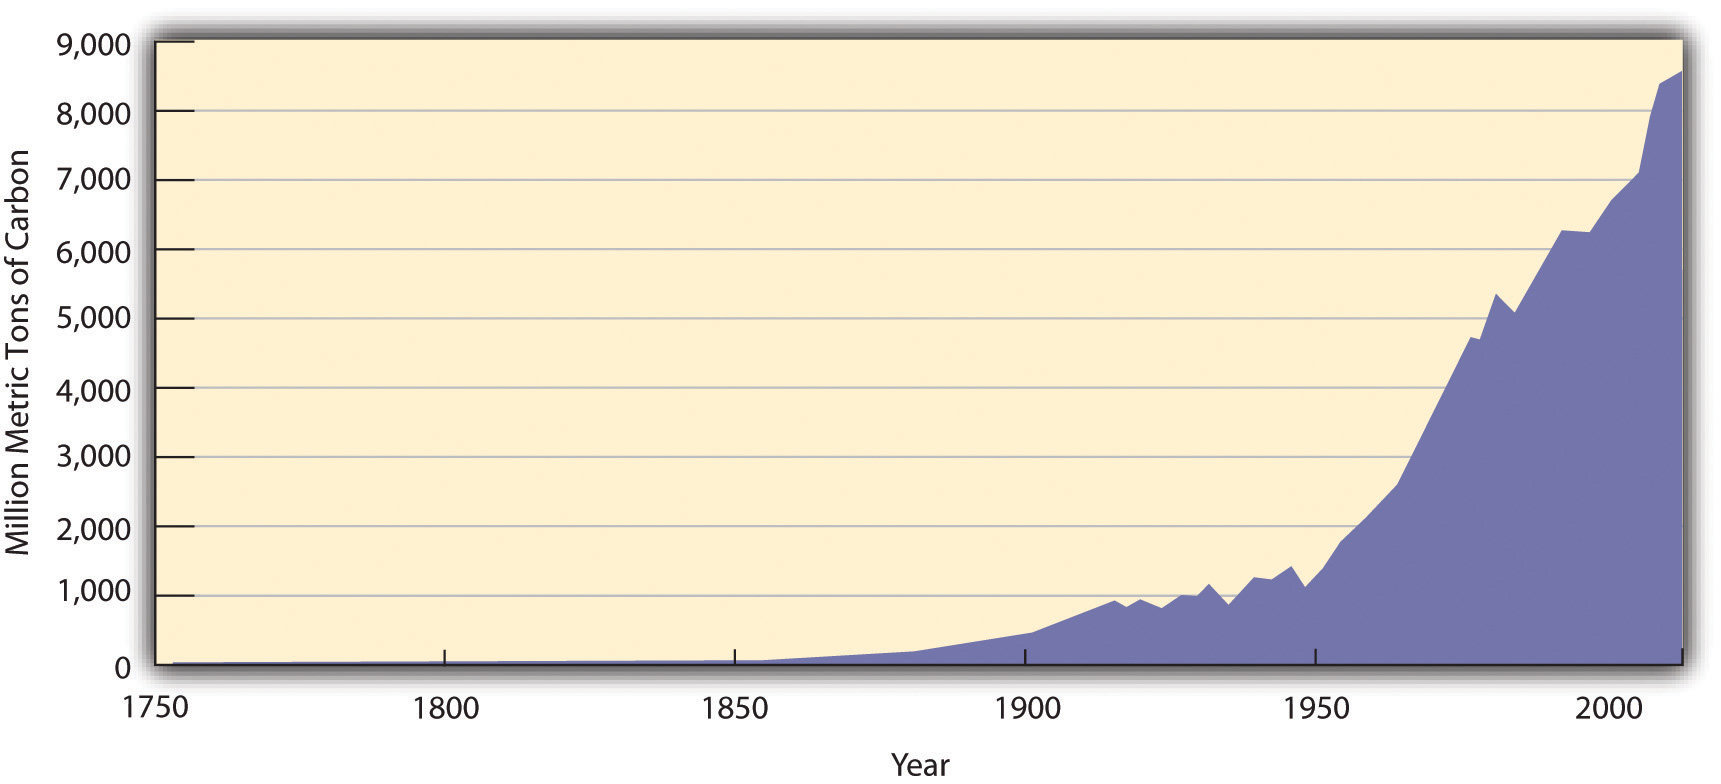
Figure 6.12. Increase in Global Carbon Emissions from Fossil Fuel Combustion, 1750–2006. Units of carbon are often used instead of CO2, which can be confusing. One ton of carbon equals 3.67 tons of CO2. Hence emissions of CO2 in 2006 were roughly eight billion tons of carbon, or twenty-nine billion tons of CO2.
Source: Oak Ridge National Laboratory, Carbon Dioxide Information Analysis Center, accessed August 19, 2010.
The earth’s climate has always varied, which initially raised doubts about the significance of human influences on climate or suggested our impact may have been positive. Successive ice ages, after all, likely were triggered by subtle changes in the earth’s orbit or atmosphere and would presumably recur. Indeed, changes in one earth system, such as solar energy reaching the earth’s surface, can alter other systems, such as ocean circulation, through various feedback loops. The dinosaurs are thought to have gone extinct when a meteor struck the earth, causing tsunamis, earthquakes, fires, and palls of ash and dust that would have hindered photosynthesis and lowered oxygen levels and temperatures. Aside from acute catastrophes, however, climate has changed slowly, on the scale of tens of thousands to millions of years. The same paleoclimatological data reported by the National Oceanic and Atmospheric Administration, (NOAA) also suggest a strong correlation between atmospheric CO2 levels and surface temperatures over the past 400,000 years and indicate that the last 20 years have been the warmest of the previous 1,000.
In the last decades of the twentieth century, scientists voiced concern over a rapid increase in “greenhouse gases.” Greenhouse gases (GHGs) were named for their role in retaining heat in earth’s atmosphere, causing a greenhouse effect similar to that in Fourier’s bell jar. Increases in the atmospheric concentration of these gases, which could be measured directly in modern times and from ice core samples, were correlated with a significant warming of the earth’s surface, monitored using meteorological stations, satellites, and other means. (Figure 6.13)
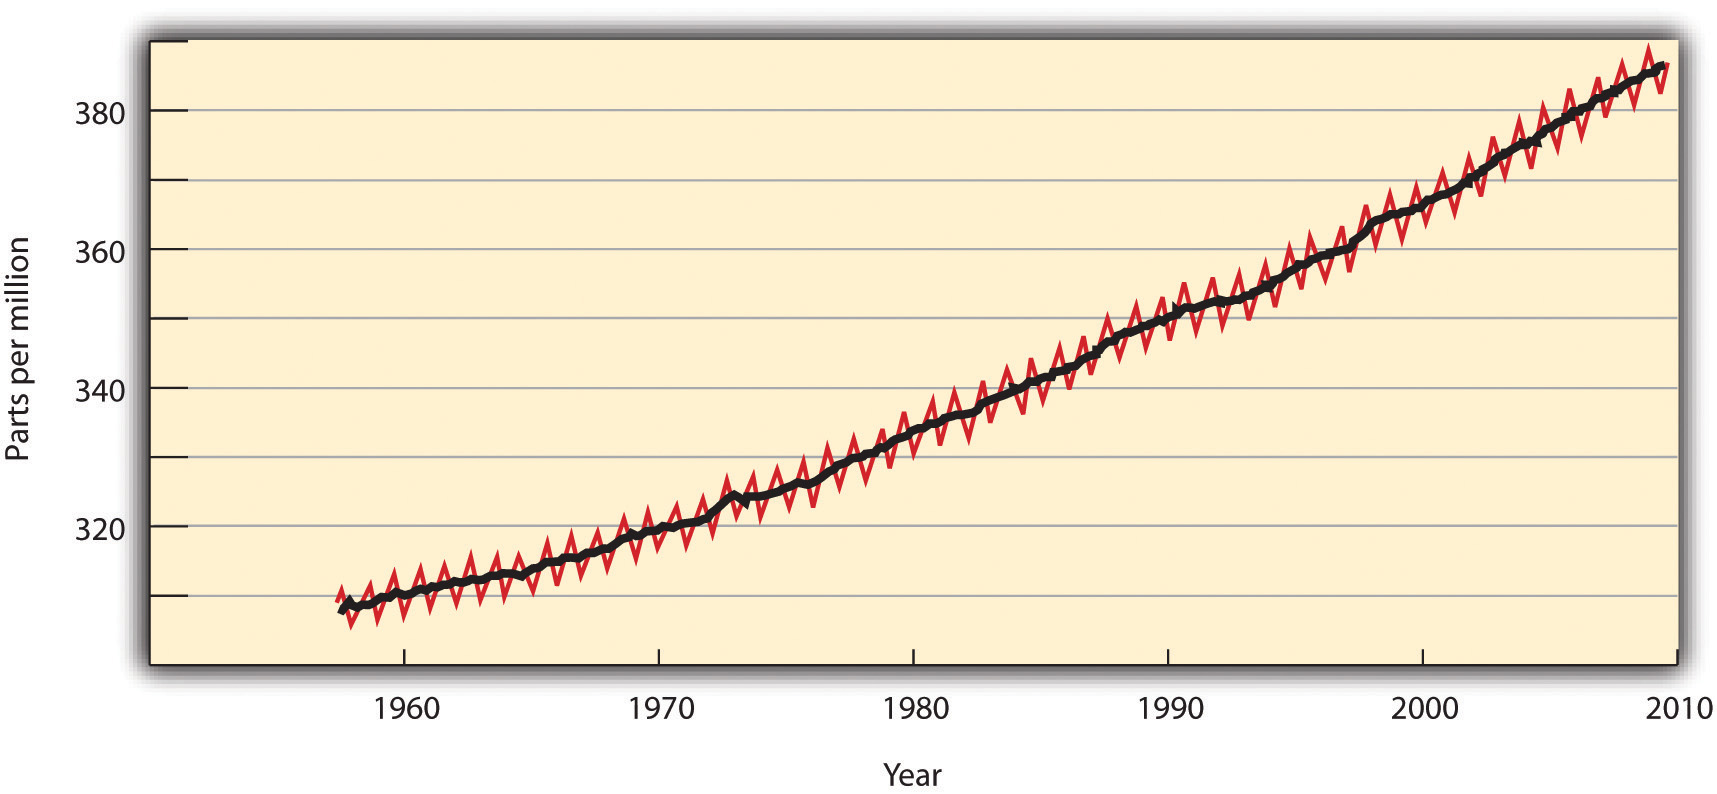
Figure 6.13. Increases in the Concentration of Atmospheric CO2, 1958–2009
Source: Scripps Institution of Oceanography and NOAA Earth System Research Lab, “Trends in Atmospheric Carbon Dioxide,” accessed August 19, 2010.
The gases currently of most concern include CO2, dinitrogen oxide (N2O), methane (CH4), and chlorofluorocarbons (CFCs). CO2, largely a product of burning fossil fuels and deforestation, is by far the most prevalent GHG, albeit not the most potent. CH4, produced by livestock and decomposition in landfills and sewage treatment plants, contributes per unit twelve times as much to global warming than does CO2. N2O, created largely by fertilizers and coal or gasoline combustion, is 120 times as potent as CO2. CFCs, wholly synthetic in origin, have largely been phased out by the 1987 Montreal Protocol because they degraded the ozone layer that protected earth from ultraviolet radiation (Figure 6.14). The successor hydrochlorofluorocarbons (HCFCs), however, are GHGs with potencies one to two orders of magnitude greater than CO2. NASA has prepared a graphical representation of the correlation of greenhouse gases like CO2 with global temperature change compared with other natural events or forms of pollution, as shown below:
Video 6.1 Correlation of Global CO2 Increases with Global Temperature Increases. Data provided by NASA GISS and IPCC
The data clearly indicate that CO2 emissions are correlated the most strongly with increasing global temperatures. Sources and amounts of greenhouse gas emissions are shown in Figure 6.14. Fossil fuel consumption accounts for approximately 65% of the greenhouse gases emitted. Deforestation and other land use changes account for roughly 18% of emissions. Other practices such as agriculture and waste processing and storage produce secondary, but potent, greenhouse gases, such as methane (CH4) and nitrous oxide (N2O).
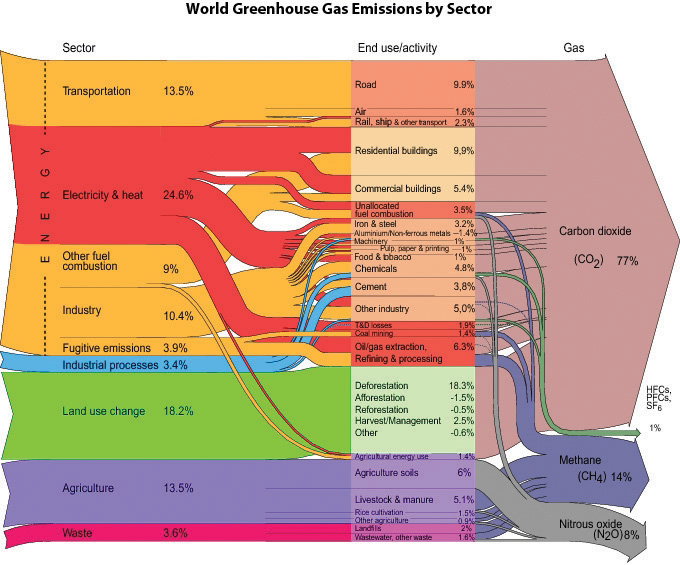
Figure 6.14 Sources and Types of GHG Emissions, 2000
Source: Riccardo Pravettoni, UNEP/GRID-Arendal and World Resources Institute, Climate Analysis Indicator Tool (CAIT), “Navigating the Numbers: Greenhouse Gas Data and International Climate Policy,” December 2005; Intergovernmental Panel on Climate Change, 1996 (data for 2000).
In response to such findings, the United Nations and other international organizations gathered in Geneva to convene the First World Climate Conference in 1979. In 1988, a year after the Brundtland Commission called for sustainable development, the World Meteorological Organization (WMO) and the United Nations Environment Programme (UNEP) created the Intergovernmental Panel on Climate Change (IPCC). The IPCC gathered 2,500 scientific experts from 130 countries to assess the scientific, technical, and socioeconomic aspects of climate change, its risks, and possible mitigation.The IPCC comprises three working groups and a task force. Working Group I assesses the scientific aspects of the climate system and climate change. Working Group II addresses the vulnerability of socioeconomic and natural systems to climate change, negative and positive consequences of climate change, and options for adapting to those consequences. Working Group III assesses options for limiting greenhouse gas emissions and otherwise mitigating climate change. The Task Force on National Greenhouse Gas Inventories implemented the National Greenhouse Gas Inventories Program. Each report has been written by several hundred scientists and other experts from academic, scientific, and other institutions, both private and public, and has been reviewed by hundreds of independent experts. These experts were neither employed nor compensated by the IPCC nor by the United Nations system for this work. The IPCC’s First Assessment Report, published in 1990, concluded that the average global temperature was indeed rising and that human activity was to some degree responsible (Figure 6.15).
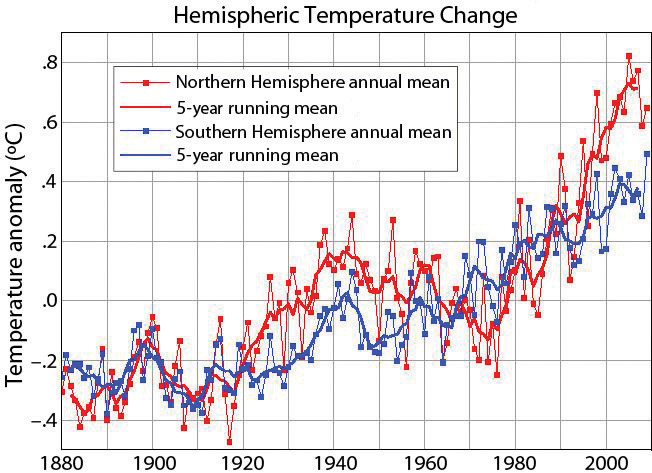
Figure 6.15. Temperature Elevation, 1880–2009
Source: NASA, Goddard Institute for Space Studies, “GISS Surface Temperature Analysis,” accessed August 19, 2010.
This report laid the groundwork for negotiation of the Kyoto Protocol, an international treaty to reduce GHG emissions that met with limited success. Subsequent IPCC reports and myriad other studies indicated that climate change was occurring faster and with worse consequences than initially anticipated. This led the UN to develop The Paris Agreement. “The Paris Agreement central aim is to strengthen the global response to the threat of climate change by keeping a global temperature rise this century well below 2 degrees Celsius above pre-industrial levels and to pursue efforts to limit the temperature increase even further to 1.5 degrees Celsius. Additionally, the agreement aims to strengthen the ability of countries to deal with the impacts of climate change.” A total of 179 parties have currently ratified this agreement and are working to meet these aims. The United States initially ratified the agreement in December of 2015. However, due to differing political agendas, it subsequently withdrew from participation in June of 2017. Even still, 17 states have joined together to form the United States Climate Alliance which commits alliance members to advance the goals of the Paris Agreement and reduce greenhouse gas emissions by at least 26-28% by 2025 (Fig. 16.16). Other countries and regions are also carrying forward to make policy changes that will significantly reduce greenhouse gas emissions. For example, the European Union has pledged to reduce emissions by 40% to below 1990 standards, and China has recently announced a new goal of using more clean energy sources than fossil fuels by 2050.
Figure 6.16 Current States participating in the United States Climate Alliance. Source: The United States Climate Alliance (accessed August 30th, 2018)
Charles David Keeling
Modern systematic measurement of CO2 emissions began with the work of scientist Charles David Keeling in the 1950s. The steady upward trajectory of atmospheric CO2 graphed by Dr. Keeling became known as the Keeling curve. This comment is from a front page New York Times article on December 21, 2010: “In later years, as the scientific evidence about climate change grew, Dr. Keeling’s interpretations became bolder, and he began to issue warnings. In an essay in 1998, he replied to claims that global warming was a myth, declaring that the real myth was that ‘natural resources and the ability of the earth’s habitable regions to absorb the impacts of human activities are limitless.’ In an interview in La Jolla, Dr. Keeling’s widow, Louise, said that if her husband had lived to see the hardening of the political battle lines over climate change, he would have been dismayed. “He was a registered Republican,” she said. “He just didn’t think of it as a political issue at all.” Justin Gillis, “Temperature Rising: A Scientist, His Work and a Climate Reckoning,” New York Times, December 21, 2010.
Effects and Predictions
The Global Climate Report for May of 2018 reports, “The May 2018 combined average temperature over the global land and ocean surfaces was 0.80°C (1.44°F) above the 20th century average of 14.8°C (58.6°F). The years 2014–2018 rank among the five warmest Mays on record, with 2016 the warmest May at +0.88°C (+1.58°F). May 2018 also marks the 42nd consecutive May and the 401th consecutive month with temperatures, at least nominally, above the 20th century average. The most notable warm temperature departures from average during May 2018 were present across much of the contiguous U.S. and Europe, where temperatures were 3.0°C (5.4°F) above average or higher.” The comparison of May temperature levels is an example of larger scale global temperature anomalies as indicated by the NASA graphic below, with 2017 being the third consecutive year in which temperatures were more than 1.8 degrees Fahrenheit (1 degree Celsius) above late nineteenth-century levels. World heat waves have also become more frequent in recent decades, including Alaska. Evidence from tree ring data in the Western United States indicates that droughts over the last 10 years represent the driest conditions seen in the last 800 years.
Video 6.2 Graphic Representation of Global Temperature Increases from 1880 – 2017. Source: NASA’s Scientific Visualization Studio. Data provided by Robert B. Schmunk (NASA/GSFC GISS).
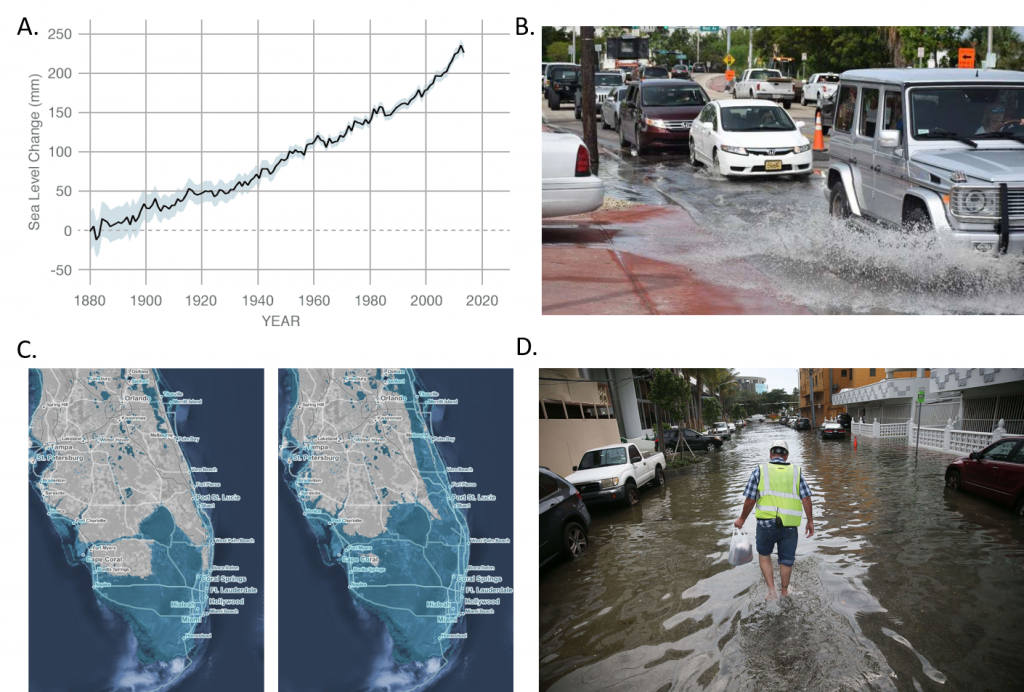
Global temperature rise has already caused significant changes on the earth. This includes the shrinkage of glaciers and ice sheets, rising sea levels (Fig 6.17), ocean warming and acidification, decrease in snow cover, and an increase in extreme weather events, such as heat waves, droughts, heavy downpours, floods, and hurricane frequency and intensity. Glaciers and mountain snowpacks, crucial sources of drinking water for many people, have been retreating for the past century. From 1979 to 2006, Arctic ice coverage declined between 6 and 10 percent, with declines in summer coverage of 15–30 percent. This has led to a global rise in sea level of approximately 8 inches. The National Climate Assessment predicts that sea levels will continue to rise between 1 and 4 feet depending on continued emission rates by 2100.
Figure 6.17 Rising Sea Levels are Becoming Problematic in Lower Elevation Communities. A. Graphic Representation of Sea Level Changes from 1880 to 2013. Source: CSIRO B. Example of High-Tide Flooding in Miami Beach. Source: Shimon Wdowinski, Ph.D., C. Map of Predicted Flooding in Florida with a 2oC (left) or 4oC (right) increase in global temperatures. Source: sealevel.climate.org D. Howard Rogers walks through a flooded street during the king tides of September 2015. Source: Joe Raedle/Getty.
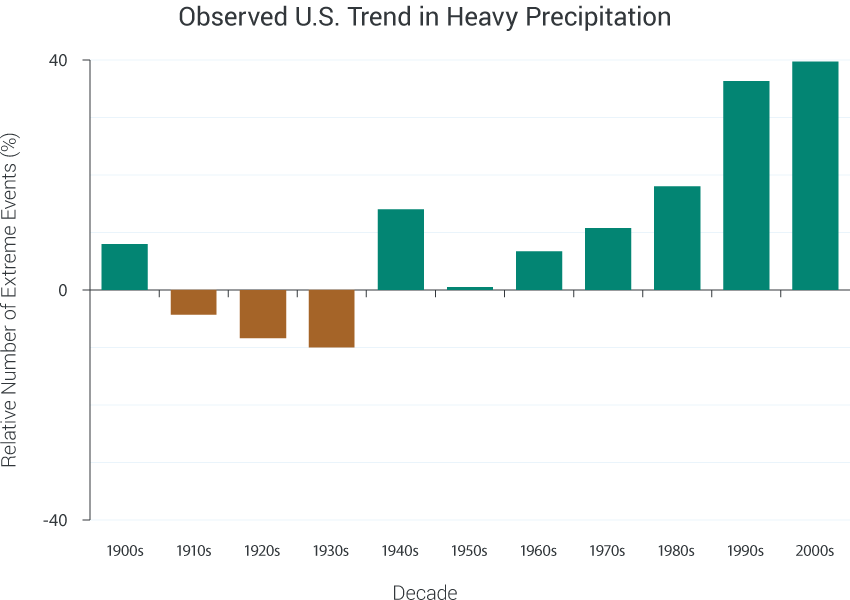
Precipitation patterns have also changed since 1900, with certain areas of northern Europe and eastern North and South America becoming significantly wetter, while the Mediterranean, central Africa, and parts of Asia have become significantly drier. Record snowfalls in Washington, DC, as reported by Bryan Walsh, in the winter of 2009–10 reflected this trend, as warmer, wetter air dumped nearly one meter of snow on the US capital in two storms. Within the United States, heavy precipitation events have become much more common in recent decades (Fig. 6.18).
Figure 6.18 Observed US Trends in Heavy Precipitation. One measure of a heavy precipitation event is a 2-day precipitation total that is exceeded on average only once in a five-year period, also known as a once-in-a-five-year event. As this extreme precipitation index for 1901-2012 shows, the occurrence of such events has become much more common in recent decades. Changes are compared to the period of 1901-1960 and do not include Hawaii or Alaska. The 2000’s decade includes data from 2000-2012. Sources: GlobalChange.gov and Kunkel, et al 2013.
Coral reefs, crucial sources of marine species diversity, are dying, due in part to their sensitivity to increasing ocean temperatures and ocean acidity. Oceans acidify as they absorb additional CO2; lower pH numbers indicate more acidic conditions. Ocean pH decreased 0.1 points between the years 1750 to 2000 and is expected to decrease an additional 0.14 to 0.35 pH by 2100.
Changing temperatures also effect the ability of species to adapt and survive in changing conditions. Observable changes in species patterns include earlier nesting patterns for migratory bird species, habitat range shifts, earlier flowering patterns. These changes can potentially create timing mismatches for different species with available food resources and/or pest avoidance putting them at greater survival risk. Within the Pacific Northwest, these shifting patterns of climate are threatening key commercial fish species such as Chinook and Coho Salmon. These cold-water fish species are heavily impacted by rising river temperatures in their native spawning grounds. Increasing water temperatures have been correlated with record low egg-to-fry survival rates, as well as increased disease susceptibility of juvenile and adult salmonids. Thus, climate change poses both immediate and long term environmental consequences to the survival of species on this planet, including humans.
Slowing Down an Amplifying Greenhouse Effect
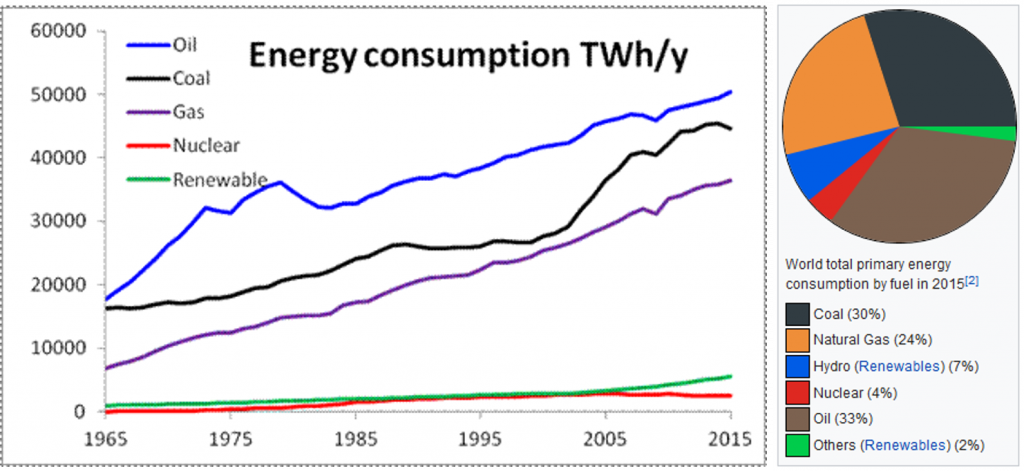
It is clear that scientists have unquestionably documented that our climate is changing in dramatic ways and that human activities are a primary cause. So what should our course of action be? Limiting and reducing greenhouse gas emissions is a critical step in this process. Key legislation and commitments by nations around the world, such as those outlined by the Paris Agreement are important foundational steps to reduce the global impact of climate change and limit maximal temperature changes. So what are countries doing to reduce emissions once they make a commitment to do so? How can technology and science be used in this process? It is clear that world energy consumption is increasing as developing nations continue to have increased energy demands (Video 6.3) and that fossil fuels dominate as the primary source of this energy (Fig 6.19)
Video 6.3 Cumulative CO2 Emissions By World Region from 1750 – 2014. Source: Our World In Data
6.19 Global Energy Consumption by Source. Left Panel shows annual production rates (TWh/y) of energy generated by each major source. Right Panel shows a graphical breakdown of total energy consumption by fuel type.
Source: Statistical Review of World Energy, Workbook (xlsx), London, 2016.
As seen in Figure 6.19, clean energy sources such as nuclear, hydroelectric, solar, wind and other renewable energies only make up a small fraction of world energy demands. While investments in the development of these energy sources to become cheaper and more efficient is crucial in creating a long term energy solution, it is not sufficient to curtail global production of CO2 from fossil fuel consumption and limit the harmful effects of global climate change. Current research is focusing on ways to sequester and store CO2 emissions from power plants and factories before it is released into the environment and on trying to reduce existing CO2 levels from the atmosphere. In this section we will focus on carbon capture methodologies that are currently being implemented at coal fire power plants. One research program being spearheaded by The Commonwealth Scientific and Industrial Research Organization (CSIRO) and the Australian Coal Association (ACA) to make carbon capture an affordable and viable option for coal power plants in Australia (Video 6.4).
Video 6.4 Description of Three Major Carbon Capture and Storage Methods for Coal Power Plants. Source: Newgencoal
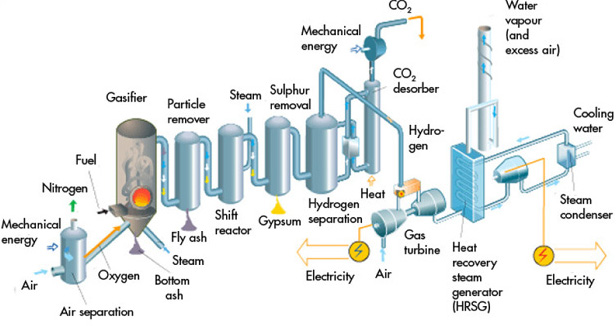
As shown in Video 6.4, there has been substantial worldwide research in this area and three major methods are most actively being developed. The first of these is called pre-combustion capture (Figure 6.20). In this system, CO2 is removed prior to the combustion process by a gasification process that produces a syngas mixture of H2, CO, CO2, and H2O. The syngas is then first cleaned by removing particulate matter. Following this, the gas mixture is exposed to the water gas shift reactor where steam is added to the syngas to help convert the CO + H2O (steam) to H2 and CO2. The air mixture first passed through a column of gypsum to remove other pollutants, such as SO2. The CO2 is then captured using chemical solvents and physical adsorbents and membranes and is liquified under high pressure. The liquified CO2 can then be transported and stored in deep underground wells using an injection process. The H2 gas that is produced can then be used in a combustion reaction to produce electricity.
Figure 6.20 Pre-Combustion Method of Carbon Capture and Sequestration for Use is Coal Power Plants. Source: Vattenfall – Global CCC Institute
The US Department of Energy (DOE) is also investing in the development of pre-combustion technologies for use in the United States and one of their flagship projects is the development of an advanced Integrated Gasification Combined Cycle (IGCC) power plant and fertilizer production facility in Kern County, CA. This facility will use a 75% coal/ 25% petroleum coke fuel blend to produce 400 MW of electricity and 1 million tons per year of fertilizer. Carbon capture at the new facility will be regulated to 90% efficiency. Current facilities of this nature are operational around the world, including the Chinese Coal Liquefaction Plant in Ordos, Inner Mongolia. This plant became operational in 2011 and has an 80% CO2 recovery rate, removing approximately 100,000 tonnes/year of CO2. Captured CO2 from this facility is injected into deep saline aquifers where it is further monitored to prevent leakage.
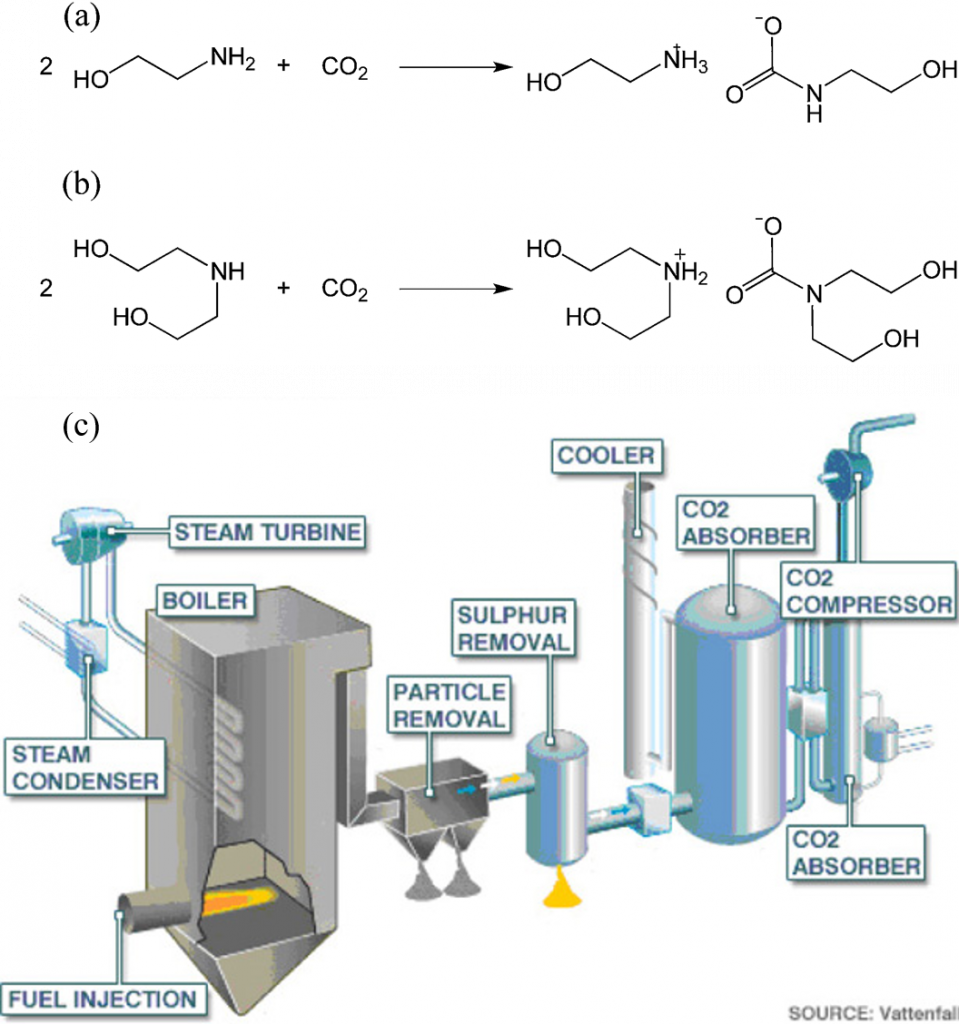
The second method of CO2 removal is post-combustion capture (Fig. 6.18) In this method, coal is burned as it has traditionally been done in a boiler to generate steam. The steam is used to turn a turbine and generate energy. The new carbon capture technology filters the flue gases before they can escape into the atmosphere. This filtration is a laborious process that requires multiple steps including particulate and sulfur removal prior to CO2 sequestration. CO2 is then removed using a chemical reaction with key solvents such as monoethanolamine (MEA) or diethanolamine (DEA) as shown in Figure 6.21.
Figure 6.21 Post-Combustion CO2 Sequestration. (a) Reaction of CO2 with monethanolamine (MEA), (b) Reaction of CO2 with diethanolamine (DEA) and (c) Power plant schematic of coal processing and carbon capture. Source: Vattenfall – Global CCC Institute.
This methodology is useful to retrofit older power plants so that carbon capture and reduction of other atmospheric pollutants is possible. The Boundary Dam Power Station in Canada is a good example of this type of post-combustion capture facility. The post-combustion capture component of this facility became operational in 2014. This facility reliably produces 120 MW of energy and reduces CO2 emissions by one million tonnes each year. This is equivalent to removing 250,000 vehicles from the road each year.
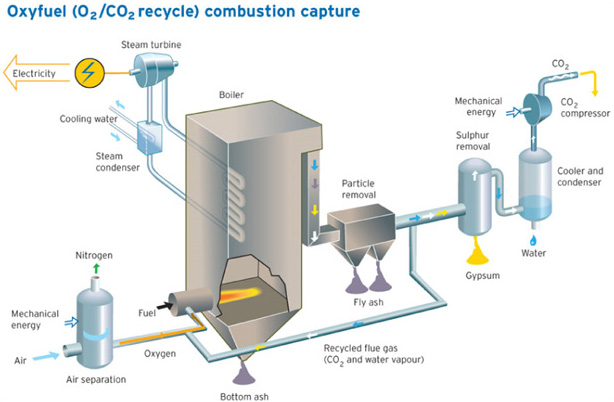
The final key capture method is called the oxyfuel process (Fig. 6.22). In this process, natural air is first enriched to produce almost pure O2 that is then used for fuel combustion. This reduces the complexity of the flue gases emitted after burning and gets rid of the need to isolate CO2 using solvents, as seen in the post-combustion method above. The fuel is then combusted to generate steam which in turn powers the turbines to produce electricity. The resulting flue gases are then trapped to remove particulate matter. Part of the mixture of CO2 and water vapor is then recycled back to the boiler to help control the temperature of the boiler, as pure O2 is being used for combustion. The remaining flue gas is then filtered to remove SOx compounds and water vapor. The purified CO2 can then be condensed from its gaseous form into a liquid and is ready for transportation and storage.
Figure 6.22 Oxyfuel Method of Carbon Capture. Source: Vattenfall and Global CCS Institute
Within this section you have been exposed so some of the technologies being developed to deal with the problem of global climate change. It should be noted that the problems are large and that projects of this scale are expensive to implement and require additional energy to be used for the carbon recapture process. Thus, the cost of energy to the consumer from these sources is generally higher or requires that governments provide extra subsidies to offset this cost increase. Thus developing nations often lack the means to utilize and develop such technologies. In addition, these technologies also often have other externalized costs including the generation of toxic waste materials, like bottom ash and fly ash (Fig. 6.19), that can pose a threat to both human and environmental health. Thus, while technologies such as these offer avenues to reduce greenhouse gas emissions, these technologies need to be coupled with a multi-tiered approach that includes reduced energy consumption, strategies for removing existing CO2 from the atmosphere, and an investment in cleaner renewable energy technologies that don’t have negative environmental impacts of fossil fuel mining, transport, and waste storage.
Suggested Assignment:
Download the following discussion-based assignment and have your students complete one or more of the topic questions to generate an interesting in class discussion: Suggested Assignment Slowing Down an Amplifying Greenhouse Effect
6.9 Chapter Summary
To ensure that you understand the material in this chapter, you should review the meanings of the following bold terms in the following summary and ask yourself how they relate to the topics in the chapter.
Chemical reactions relate quantities of reactants and products. Chemists use the mole unit to represent 6.022 × 10²³ things, whether the things are atoms of elements or molecules of compounds. This number, called Avogadro’s number, is important because this number of atoms or molecules has the same mass in grams as one atom or molecule has in atomic mass units. Molar masses of substances can be determined by summing the appropriate masses from the periodic table; the final molar mass will have units of grams.
Because one mole of a substance will have a certain mass, we can use that relationship to construct conversion factors that will convert a mole amount into a mass amount, or vice versa. Such mole-mass conversions typically take one algebraic step.
Chemical reactions list reactants and products in molar amounts, not just molecular amounts. We can use the coefficients of a balanced chemical equation to relate moles of one substance in the reaction to moles of other substances (stoichiometry). In a mole-mass calculation, we relate the number of moles of one substance to the mass of another substance. In a mass-mass calculation, we relate the mass of one substance to the mass of another substance.
Additional Exercises
-
If the average male has a body mass of 70 kg, of which 60% is water, how many moles of water are in an average male?
-
If the average female is 60.0 kg and contains 0.00174% iron, how many moles of iron are in an average female?
-
How many moles of each element are present in 2.67 mol of each compound?
- HCl
- H2SO4
- Al(NO3)3
- Ga2(SO4)3
-
How many moles of each element are present in 0.00445 mol of each compound?
- HCl
- H2SO4
- Al2(CO3)3
- Ga2(SO4)3
-
What is the mass of one hydrogen atom in grams? What is the mass of one oxygen atom in grams? Do these masses have a 1:16 ratio, as expected?
-
What is the mass of one sodium atom in grams?
-
If 6.63 × 10⁻⁶ mol of a compound has a mass of 2.151 mg, what is the molar mass of the compound?
-
Hemoglobin (molar mass is approximately 64,000 g/mol) is the major component of red blood cells that transports oxygen and carbon dioxide in the body. How many moles are in 0.034 g of hemoglobin?
Answers
-
2,330 mol
-
- 2.67 mol of H and 2.67 mol of Cl
- 5.34 mol of H, 2.67 mol of S, and 10.68 mol of O
- 2.67 mol of Al, 8.01 mol of N, and 24.03 mol of O
- 5.34 mol of Ga, 8.01 mol of S, and 32.04 mol of O
-
H = 1.66 × 10⁻²⁴ g and O = 2.66 × 10⁻²³ g; yes, they are in a 1:16 ratio.
-
324 g/mol
(Back to the Top)
6.10 References:
Chapter 6 materials have been adapted and modified from the following creative commons resources unless otherwise noted:
1. Anonymous. (2012) Introduction to Chemistry: General, Organic, and Biological (V1.0). Published under Creative Commons by-nc-sa 3.0. Available at: http://2012books.lardbucket.org/books/introduction-to-chemistry-general-organic-and-biological/index.html
2. Poulsen, T. (2010) Introduction to Chemistry. Published under Creative Commons by-nc-sa 3.0. Available at: http://openedgroup.org/books/Chemistry.pdf
3. OpenStax (2015) Atoms, Isotopes, Ions, and Molecules: The Building Blocks. OpenStax CNX.Available at: http://cnx.org/contents/be8818d0-2dba-4bf3-859a-737c25fb2c99@12.
4. Schmitz, A. (2012) Climate Change Chapter from the book Entrepreneurship and Sustainability (v. 1.0). Published under Creative Commons by-nc-sa 3.0. Available at: https://2012books.lardbucket.org/books/entrepreneurship-and-sustainability/s09-01-climate-change.html
5. Shaftel, H., Jackson, R. and Callery, S. (2018) Global Climate Change – Vital Signs of the Planet. Published by: Earth Science Communication Team at NASA’s Jet Propulsion Laboratory. Retrieved on August 24th, 2018
4. Wacowich-Sgarbi, S. and the Langara Chemistry Department. (2018) CHEM1114 – Introduction to Chemistry. BCcampus. Available at: https://pressbooks.bccampus.ca/chem1114langaracollege/




















![This figure is labeled, “a,” and, “b.” Part a shows an open bottle of ibuprofen and a small pile of ibuprofen tablets beside it. Part b shows a reaction along with line structures. The first line structure looks like a diagonal line pointing down and to the right, then up and to the right and then down and to the right. At this point it connects to a hexagon with alternating double bonds. At the first trough there is a line that points straight down. From this structure, there is an arrow pointing downward. The arrow is labeled, “H F,” on the left and “( C H subscript 3 C O ) subscript 2 O,” on the right. The next line structure looks exactly like the first line structure, but it has a line angled down and to the right from the lower right point of the hexagon. This line is connected to another line which points straight down. Where these two lines meet, there is a double bond to an O atom. There is another arrow pointing downward, and it is labeled, “H subscript 2, Raney N i.” The next structure looks very similar to the second, previous structure, except in place of the double bonded O, there is a singly bonded O H group. There is a final reaction arrow pointing downward, and it is labeled, “C O, [ P d ].” The final structure is similar to the third, previous structure except in place of the O H group, there is another line that points down and to the right to an O H group. At these two lines, there is a double bonded O.](https://pressbooks.bccampus.ca/chem1114langaracollege/wp-content/uploads/sites/387/2018/04/CNX_Chem_04_04_GreenChem-2.jpg)

