Statistics
Can You Guess These Food Insecurity Statistics?
Published Mar. 1, 2021 by Josh Salsbury
The USDA defines food insecurity as the lack of reliable access to enough food for a healthy life. This is a distinct term from hunger, which describes the physical sensation of needing food. It’s important to understand this difference because hunger is a short term problem, but food insecurity is a complex issue with many systemic underlying causes that requires long term solutions. Knowing that, can you guess these statistics about food insecurity?
Let’s start out by looking at the rate of food insecurity of different populations. In this case, the rate of food insecurity means what percentage of a population is food insecure. Before you look, can you guess what percentage of WOU students are food insecure? How do you think that compares to other demographics?
How do WOU students compare to other demographics?

Source Patton-López Study
Source Feeding America Report
Result: WOU students are about five times more food insecure than the average American
Did you guess correctly? Many people are familiar with the stereotype of “the poor college student,” and this data shows how severe it truly is, with more than half of WOU students in 2014 facing food insecurity. Students are a particularly vulnerable demographic because they face many expensive costs and generally have low incomes. This means that it is especially important for students to have reliable access to programs that help them meet their needs.
The Food Pantry’s Services
Before we take a look into the Food Pantry statistics, it’s important to understand our service and where the data comes from. First of all, the terms food pantry and food bank are often used interchangeably, but they actually perform different functions. If a food pantry is like a local grocery store, then a food bank is the distributor. The WOU Food Pantry is registered with the Marion Polk Food Share, which is a food bank in Salem. This means that we receive regular shipments of food from the Food Share, in exchange for following certain distribution guidelines, safety protocols, and recordkeeping practices.
Distribution guidelines just means how we get food to our customers. The Food Pantry uses a client-choice model. This means customers can choose the items they want, just like in a grocery store, which research indicates is a more dignifying and less wasteful way to run a food pantry. The opposite of this model would be a prearranged-bag system where customers receive premade boxes of goods. If you were using a food pantry, which one would you prefer?
Our pantry is also particularly unrestrictive because customers can visit us an unlimited number of times, shop for as many items as they want, and they don’t need to sign up or present any identifying information to use our service. Then, you might wonder how we collect any data about our services? Well, we don’t collect identifying information such as someone’s name or student ID, but we do ask customers to fill out an anonymous checkout survey to complete their visit. This includes questions such as “how many people are providing food for?” and “how many pounds of food did you select?” This allows us to have data about each visit to the Pantry, which we can then use to track our performance.
Now that you know where our data comes from, let’s dive into the numbers. While the Food Pantry was open earlier, we have detailed data going back to 2017. In that time, how many people do you think we’ve served? How many pounds of food have we distributed?
Visits To The Pantry
Times People Received Food
Pounds Of Food Distrbuted
Source Internal Food Pantry Data
Those are some pretty impressive numbers! They also happen to demonstrate some of the consequences of how we collect data. You might have wondered why we didn’t include the number of unique individuals we’ve served, or why we used the phrase “number of times people received food?” Remember earlier we said that we don’t collect identifying information from our customers. This means that we actually don’t know how many unique Pantry users there are, and there’s not a way for us to find that out without compromising our value of being an anonymous service. But that still doesn’t answer what the “number of times people received food” means.
Essentially, we have data on the number of people for whom each visitor is shopping. For example, one visitor to the Pantry could be shopping for their family of five, which means that five people received food from us in total. If that same person came back the next week, their family of five would receive food again bringing our total to 10 people who benefited from our services. Since we don’t have a way to keep track of unique individuals, our data has no way of knowing that it was the same five people from last week. It only knows that people received food 10 times.
We can get around this slightly by asking each visitor if it is their first visit of the month, and this does tell us how many unique visitors we get each month. In January 2021, we received 101 visits. In that month, people said it was their first visit of the month 48 times, so that tells us there were 48 unique Food Pantry users in January 2021. Does 48 unique visitors seem low to you? After all, the first chart in the introduction showed that 59% of WOU students in 2014 experienced food insecurity. WOU has over 4,000 undergraduate students, so shouldn’t we expect at least 4,000 × 59% = 2,360 students to visit us?
A 2017 study at the University of Florida found that just 38% of food insecure students reported using the campus food pantry. The study identified four main barriers to students using the pantry:
- Inconvenient hours
- Insufficient information on how the program works and what determines eligibility
- Self-identity, or the feeling that the food pantry was not for them
- Social stigma and embarrassment
As one of the coordinators of the WOU Food Pantry, the first two items are operational; those are things that I can fix on the job. On the other hand, the last two items are things that we need to work on as a community. I can personally tell you that almost all of the customers I’ve talked to have experienced at least one of those issues. And those are just from the people who had the courage to come in. I’m sure there are many, many more people who didn’t get that far because they didn’t feel comfortable using the Food Pantry.
Generally speaking, our community is very supportive of the Pantry. From students, staff and faculty, campus clubs and organizations, and local businesses, the WOU Food Pantry actually does have a wide, generous network of support. All the resources for success are already present, and we just need to go that extra mile to help our food insecure students feel more comfortable accessing our services.
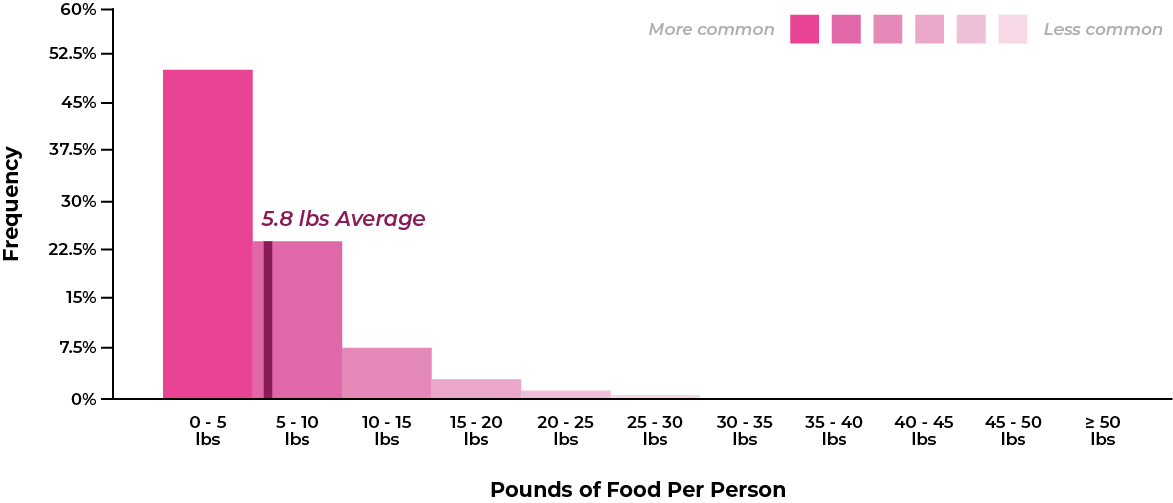
How much food do our customers shop for?

Source Internal Food Pantry Data
Result: About 75% of customers shop for between 0 and 10 pounds of food per person
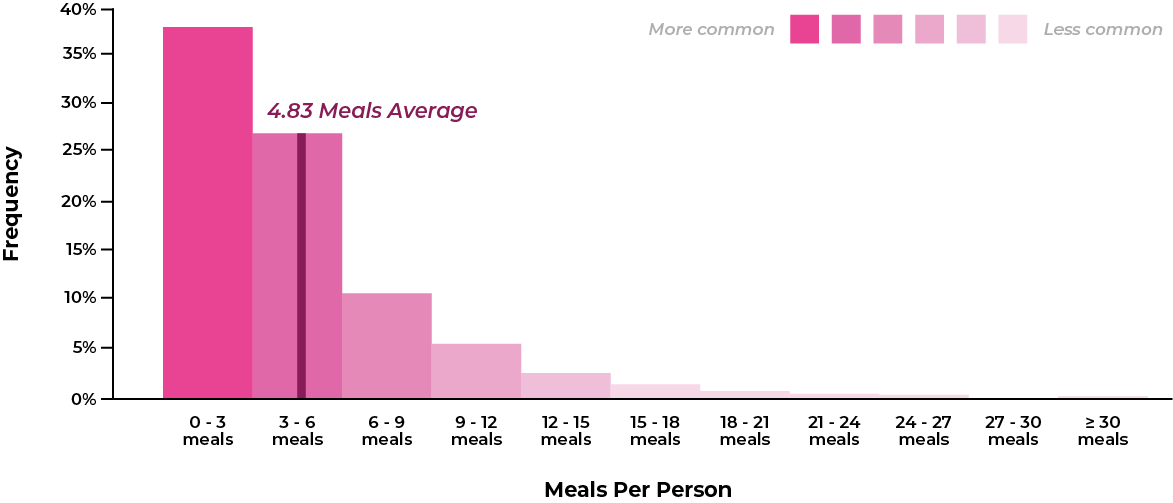
How many meals do our customers shop for?

Source Internal Food Pantry Data
Result: About 75% of customers shop for between 0 and 6 meals per person
The Effect of COVID-19
The global pandemic has affected many parts of our lives, and it has also had a big impact on the Food Pantry. The most noticeable for us was the way it affected the number of customers coming to see us. With everything that you know about COVID, do you think the number of visits to the Pantry would go up or down because of the pandemic? Let’s take a look:
How has COVID-19 affected the number of visits the Food Pantry receives?

Source Internal Food Pantry Data
Result: The number of monthly visits has decreased significantly
So what’s the takeaway here? On average, the Food Pantry receives 170 fewer visits per month than we did before COVID-19. Did the rate of food insecurity at WOU go down? Well, we can’t answer that directly without conducting another survey, but we can look at how COVID has impacted the rate of food insecurity for the rest of the country.
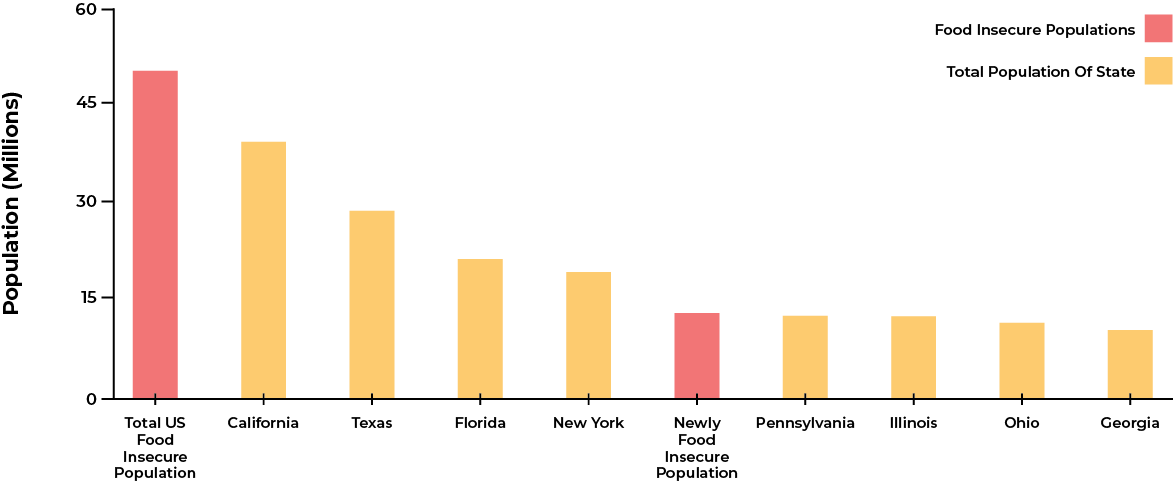
According to a Feeding America report, the projected national rate of food insecurity for 2020 is 15.6%, which is up from 11.5% in 2018. This increase represents an additional 13.2 million Americans experiencing food insecurity. To put that into perspective, the fifth most populous state, Pennsylvania, has 12.8 million people. Additionally, since the onset of the pandemic, the United States saw a dramatic increase in the unemployment rate, which undoubtedly affects people’s ability to provide food for themselves.
How many people in the United States are food insecure compared to the size of states?

Source Feeding America Report
Source US Census Data
Result: The total United States food insecure population is larger than the most populous state
United States unemployment rate over time

Source Pew Research Article
Source Statistia Report
Result: The unemployment rate sharply increased between March and April
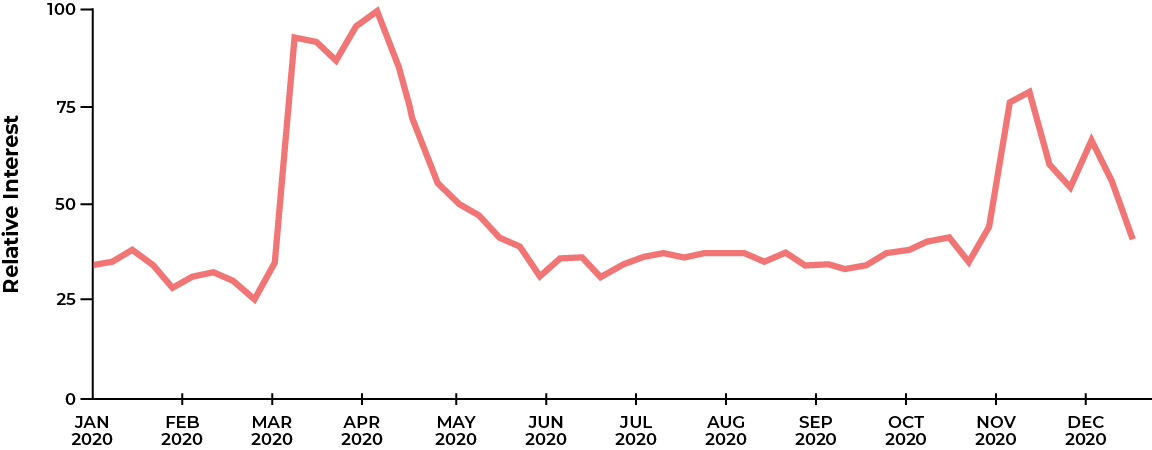
Google search trends relative interest of “Food Bank” over time

Source Google Search Tends
Result: Increased interest for food banks in 2020 starting in March
Then, the more likely explanation for why the Food Pantry is receiving less visits is because we are serving fewer people. At the start of the pandemic, many students moved back home from Monmouth. WOU students represent the majority of our customers, so it makes sense that we would see a sharp decline as they left the area. Additionally, the Food Pantry faced several challenges at the start of COVID-19, including: significantly fewer volunteers, reduced hours of operation, and changes to our shopping model that greatly increased wait times. As we have adapted to operating during the pandemic, we’ve been able to slowly iron out these problems, and you can see that in the past three months our visits have actually been trending upward. Our hope is that we can continue to improve how we connect with students during this time, and that things will return to normal in the near future.
Conclusion
The past few months, we have made an effort to improve the consistency of our data collection and analysis. Until now, this is a detailed look into the Food Pantry that most people haven’t gotten to see before. Food insecurity is an incredibly complex issue, and there is a lot of really interesting data hiding beneath the surface. Ultimately, your takeaways from this should be that food insecurity affects a lot more people than you probably thought it did. Our community is already doing a lot to help them, but there’s still a lot of work for us to do to break down the social barriers and stigma to acknowledge the realities of food insecurity.

