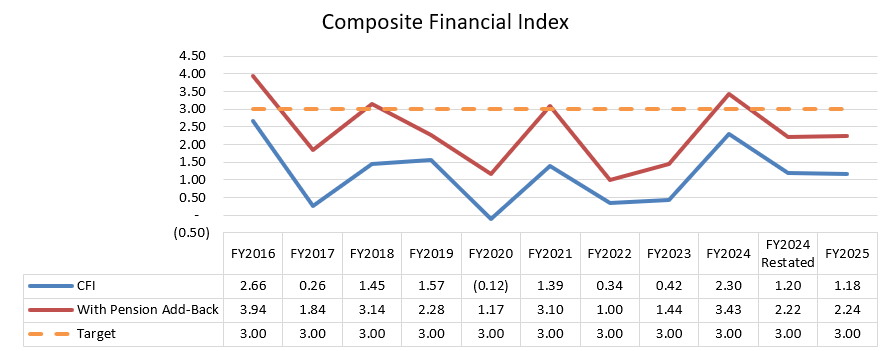
Budget Dashboard
Undergraduate Enrollment
Graduate Enrollment
Gross Tuition & Remissions
Net Tuition & Fees per FTE
Cost per FTE
E&G Fund Balance as a % of Revenues
E&G Expenses
5 Year Sustainability Plan
Current Ratio
The current ratio measures an WOU’s liquidity serving as an indicator of the ability to meet current obligations. This simple calculation matches the institution’s short-term assets with liabilities expected to come due during the same period.
Generally accepted standards for this ratio indicate a 2:1 coverage as being desirable.
The numerator is total current assets; the denominator is total current liabilities. Both numbers come directly from the Statement of Net Position.
FY20 | FY21 | FY22 | FY23 | FY24 |
1.883 | 1.851 | 1.643 | 1.083 | 1.045 |
Primary Reserve Percentage
The primary reserve ratio compares the level of assets that an organization can quickly access and spend to satisfy its fiscal obligations. In describing the organization’s ability to support current operations from available expendable resources, the ratio measures financial strength of the organization.
Expendable net assets should increase at a level commensurate with growth in operational activity. Monitoring this ratio allows a tracking of growth and whether or not growth in resource levels provides an appropriate margin for dealing with opportunity or adversity.
The numerator (expendable net assets) is comprised of unrestricted net assets and expendable restricted net assets as reported in the Statement of Net Position. The denominator is comprised of operating expenses as reported in the Statement of Revenues, Expenses, and Changes in Net Position.
FY20 | FY21 | FY22 | FY23 | FY24 |
3.90% | 2.52% | 5.04% | 4.51% | 3.95% |
Return on Net Asset Percentage
This percentage measures economic return in order to determine whether an institution generated or used net position in a given year. Major changes are generally due to major gifts or appropriations for capital investment.
The numerator for this formula is increase/ (decrease) in net assets, the denominator is net assets at the beginning of the year. Both are found in the Statement of Revenues, Expenses, and Changes in Net Position.
FY20 | FY21 | FY22 | FY23 | FY24 |
-6.47% | 6.24% | -0.59% | -0.95% | 19.72% |
Viability Ratio
The viability ratio indicates the relative liquidity of the university in measuring the availability of sufficient cash, or other convertible assets, to pay institutional obligations as of the date of the Statement of Net Assets.
There are no absolute thresholds for this ratio in that long-term debt need not be paid off at once. Of more importance are long-term trends in direction. Long-term declines would limit the ability to deal with adverse impacts or to take on new projects.
The numerator (expendable net assets) consists of unrestricted net assets and expendable restricted net assets. The denominator is total non-current liabilities (e.g., long-term debt). Both are found in the Statement of Net Position.
FY20 | FY21 | FY22 | FY23 | FY24 |
0.0496 | 0.0259 | 0.0792 | 0.0694 | 0.0575 |