Welcome to WOU's Data Quick Views page!
This page contains a variety of visualizations on students and staff at WOU, covering topics such as degrees awarded, enrollment,
faculty and staff demographics, retention and graduation, and tuition and financial aid information.
Each year the most recent data is added as a new Data Quick Views page. For example, you are currently on the 2023-24 Data Quick View page.
We continually add data as it becomes available. Please refer to previous years if you are looking for a figure that hasn’t been added to the current year’s page.
The figure below shows data from 2022-23 so we could show comparator institutions; however, the menu on the left shows data from 2023-24.
Please explore the visualizations!
If you have questions, comments, or feedback, please contact either Mike Baltzley (baltzlem@wou.edu) or Georgia Armitage (armitageg@wou.edu).
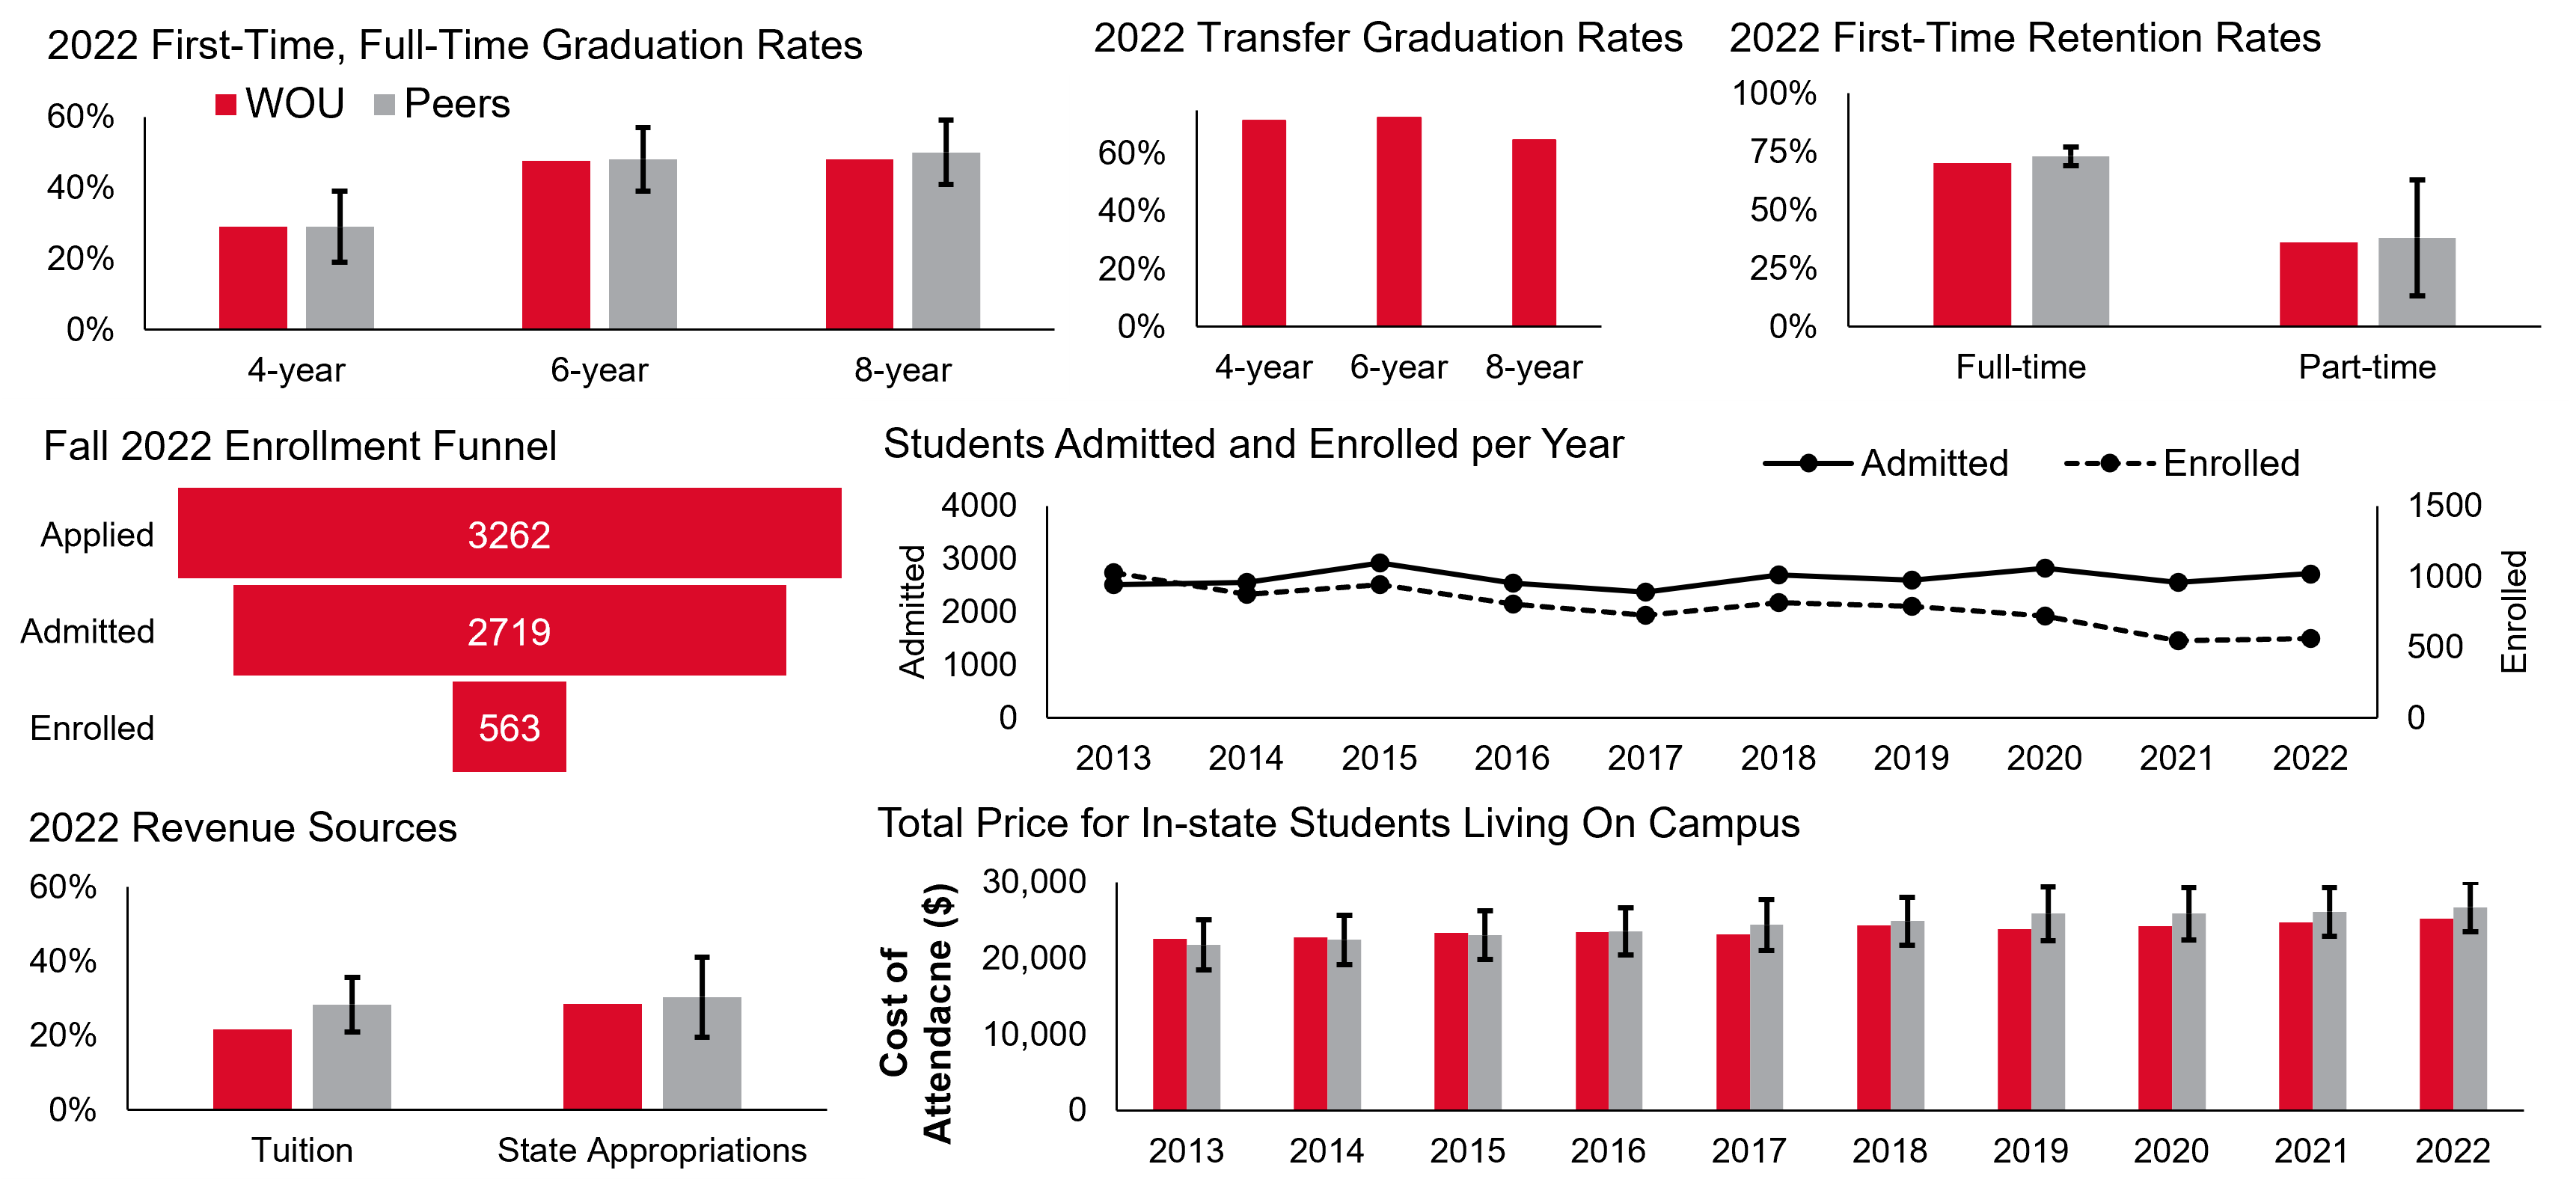
The data depicted in the image above can be found below:
First-Time, Full-Time Graduation Rates
Transfer Graduation Rates
First-Time, Full-Time Retention Rates
Enrollment Funnel
Admitted and Enrolled by Year
Revenue Sources
Cost of Attendance